
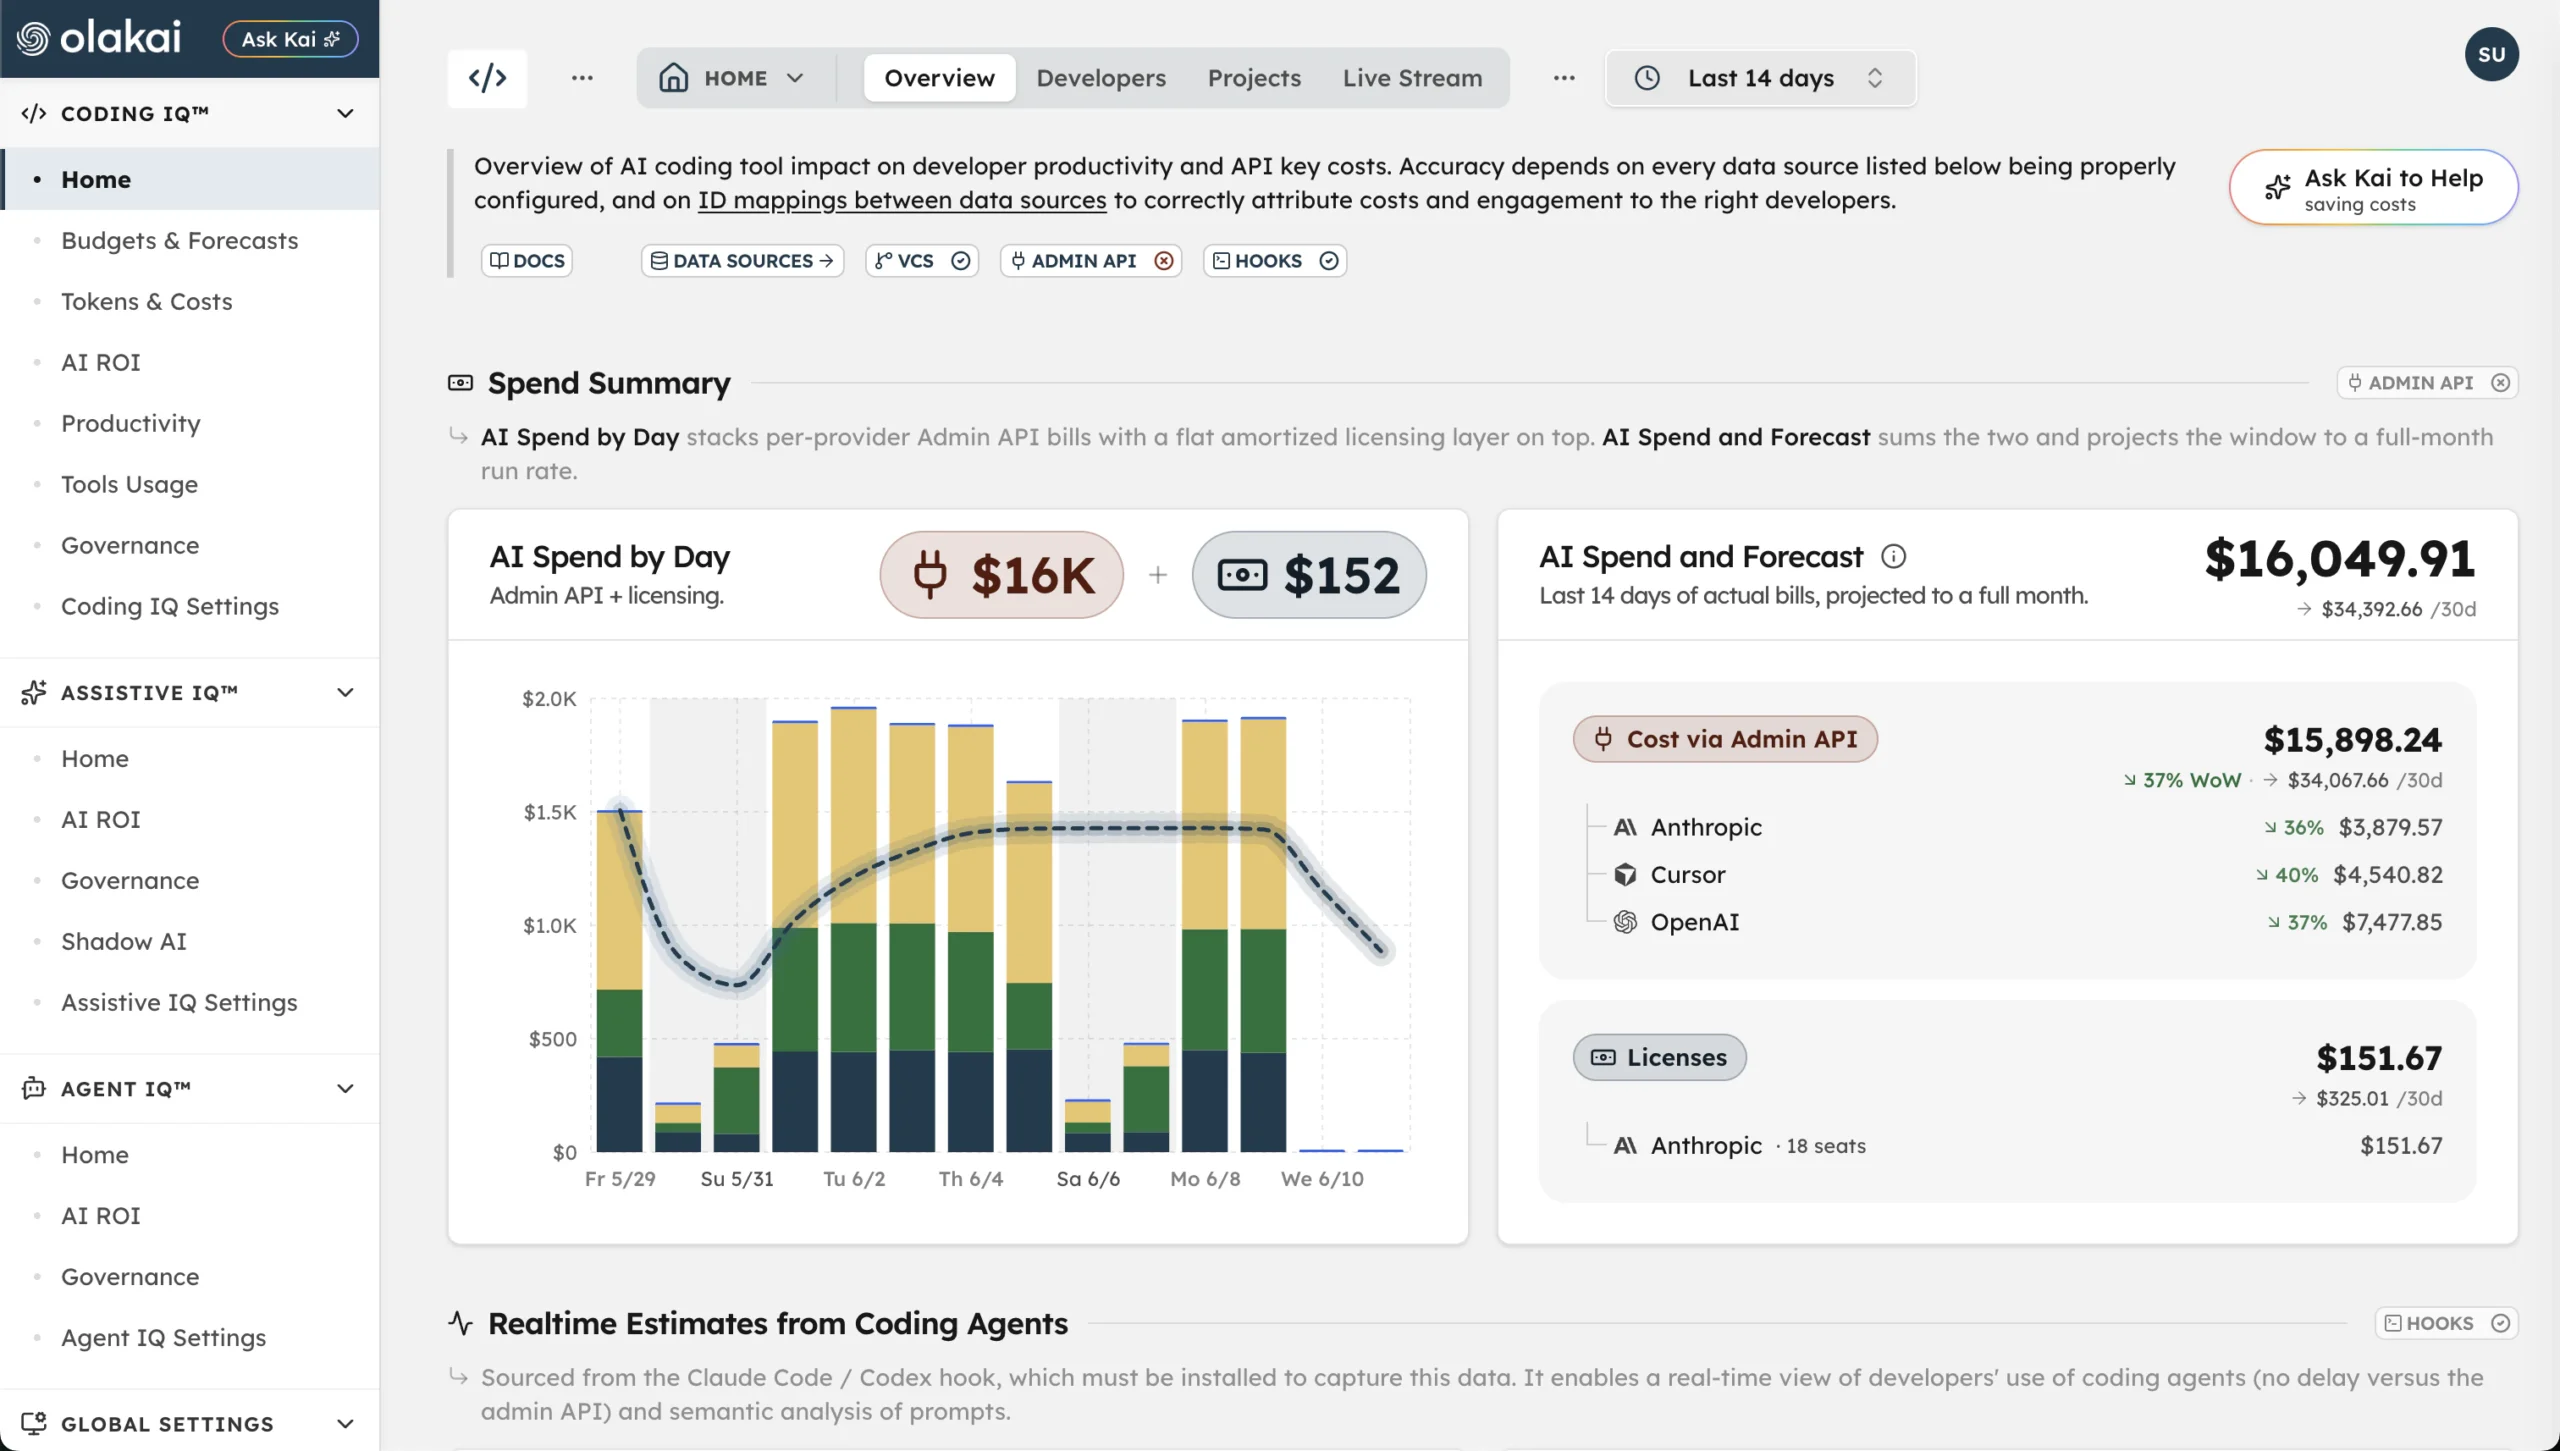

Ask most VPs of Engineering how AI coding tools are doing on their team, and you’ll get an adoption number: “80% of developers used Claude Code or Cursor last month.” That number answers a real question, but not the one the CFO is actually asking. Adoption tells you who opened the tool. It says nothing about whether the team is shipping more, shipping faster, or shipping the same amount of code with an extra subscription line item attached.
That gap is wider than most engineering leaders assume. A Black Duck survey of over 800 enterprise software engineers and DevOps professionals, published in June 2026, found AI coding assistant adoption had hit 97% — functionally universal — while the same research pointed to governance and measurement, not adoption, as the actual multiplier on ROI. Everyone has the tool. Not everyone can prove what it’s doing. That’s the exact problem the Olakai Agentic AI Impact Dashboard was built to close, and it’s worth walking through how it actually does that, tab by tab, rather than taking the “proof of AI value” claim on faith.
Overview: what you’re actually spending, and what came back
The Overview tab starts with money, and it’s careful about which money is real. The Spend Summary section adds two genuinely different billing streams together: Admin API costs, which are token-billed usage pulled straight from Anthropic, Cursor, and OpenAI’s Admin APIs — the same figure that lands on the actual invoice for usage-priced plans — and licensing costs, seat subscriptions like Cursor Business or GitHub Copilot seats, prorated to the selected window. Most companies pay both at once: token bills for power users on usage plans, seat licenses for everyone else on subscription plans. Adding them together is the number finance actually writes the check for.
What the dashboard refuses to call the resulting monthly figure is instructive. The “Projected 30 day” number is explicitly labeled a straight-line extrapolation, not a forecast — actual spend times 30 divided by 7, answering “if the next 23 days look like the last 7, what does a full month cost?” It doesn’t model growth, seasonality, or seat changes, and Olakai says so in the product rather than letting a rough projection masquerade as a confident prediction. That distinction matters more than it sounds like it should: a lot of AI analytics tools show a single “forecasted spend” number with no indication of how much confidence to put in it.
The Codebase Outcomes section is where spend turns into a claim about output — AI Code Ratio (the percentage of lines from AI-assisted pull requests, daily) and PR Volume (AI versus non-AI PRs per day), framed explicitly as “the shipped result of the AI coding activity above.” It’s a deliberate causal chain: spend, then activity, then shipped outcome — not three unrelated charts sitting next to each other.
PR Analysis: a three-way split, not a binary one
The PR Analysis tab is the place most “is AI making us ship more?” conversations should start. Instead of a simple AI-versus-human split, every pull request in the window lands in one of three buckets: Fully Agentic (an AI agent drove it end to end — Claude Code, Cursor Agent, and similar), Human + AI Assisted (AI helped, but a person drove the work), and Non-AI. Each bucket shows both a count and its share of all PRs, and the distinction between fully agentic and assisted work is the kind of nuance that a single “AI adoption %” figure erases entirely — a team where AI opens and merges PRs unsupervised is a fundamentally different governance conversation than one where AI is a fast autocomplete for human-driven work.
Underneath the headline split sits a searchable, sortable table with per-PR granularity: repository, author, percentage of AI-attributed code, which specific AI tools touched the PR, lines added and removed, cycle time, and merge date. That level of detail is what turns “our AI adoption looks healthy” into something a VP of Engineering can actually defend in a planning meeting — a specific repo, a specific tool, a specific number, not an aggregate percentage nobody can trace back to real work, and it’s the same granularity that separates a real AI coding tool ROI metric from acceptance-rate vanity numbers.
Cycle Time: the tail matters as much as the average
The Cycle Time tab compares AI-assisted and non-AI pull requests at three percentiles — p50, p75, and p90 — each with a “N% faster” or “N% slower” delta column. That’s a deliberate methodological choice, not an arbitrary one: p50 tells you what a typical PR looks like, while p90 tells you whether AI is helping — or actively hurting — the slow tail of your worst cases. An average alone can hide a tool that makes routine work faster while making the hard, unusual PRs meaningfully worse; percentiles don’t let that hide.
The tab also tracks issue linkage — the average number of tracked issues linked per PR via Fixes #N or Closes #N references — alongside the overall first-pass approval rate, as a check on whether AI-assisted PRs are solving planned, tracked work or generating ad-hoc changes nobody asked for. And it’s explicit about its own limits: breakdowns are available per-repository and per-AI-tool, but there is no per-team view on this tab. If you need a team-level cut, that’s a different report, not a filter you’re missing here.
The number that goes in the board deck
All of this rolls up into two composite figures designed for a leadership audience rather than an engineering one. The AI Productivity Score is a 0-100 composite built from four weighted components — Adoption (25 points), Speed (30 points), Quality (25 points), and Efficiency (20 points) — giving a single number that moves as the underlying PR data moves, with an eight-week trend sparkline. Next to it sits AI Equivalent Engineers: the productivity gain expressed as “how many additional full-time engineers’ worth of output your AI tools are producing,” which converts into a quarterly dollar figure at a configurable fully-loaded engineer cost (the default is $200,000 a year).
The honest part is what happens when the sample is small. Olakai attaches an explicit confidence tier to the Equivalent Engineers figure based on how many developers qualify for the underlying before/after comparison: High confidence needs 15 or more qualifying developers and is described as suitable for executive reporting; Medium is 5 to 14, useful for planning; Low is 3 to 4, a preliminary signal only; and below 3 qualifying developers, the guidance is blunt — do not use this for decisions. That’s an unusual thing for an analytics vendor to put in its own product: a built-in instruction not to trust its own headline metric below a stated threshold. For a platform built on the premise of vendor-neutral, board-ready proof rather than vanity dashboards, that kind of restraint is the point, not an afterthought.
Two things the Impact Dashboard covers in more depth than this post has room for: the Developers tab, which breaks adoption down into cohorts covered in depth in Power, Casual, New, Idle, and the Productivity tab’s before/after methodology, which compares each developer against their own historical baseline rather than against peers. Both are real, separately documented mechanisms worth their own explanation.
None of this requires installing anything new on a developer’s machine — it runs on pull request data Olakai already has access to through your connected GitHub, Bitbucket, or GitLab organization, which is also why it works the same way regardless of which AI coding tools your teams actually use. That vendor-neutral posture is what makes the dashboard useful for a mixed fleet — Claude Code here, Cursor there, Copilot somewhere else — instead of a single-vendor usage report dressed up as an ROI tool, and it’s the same reason generating code isn’t the same as generating value across a mixed toolset.
If your organization already has a mixed toolset and a growing AI coding bill, the harder question isn’t whether to measure impact — it’s whether the number you’re currently reporting up would survive this level of scrutiny. Talk to an Expert to see the AI Impact Dashboard against your own repositories.
Sources: Black Duck, “AI Coding Hits 97% Enterprise Adoption,” June 2026.