In May 2026, Uber’s COO Andrew Macdonald said something that should make every CFO uncomfortable. Uber had burned through its entire 2026 AI budget in four months — deploying Anthropic’s Claude Code to roughly 5,000 engineers, watching per-engineer token costs hit $500 to $2,000 per month, and reaching April before anyone noticed the year was over. When pressed on the return, Macdonald said: “That link is not there yet.” Meaning Uber — a $140B technology company with sophisticated financial infrastructure — cannot draw a line between its AI spend and any consumer feature shipped to customers.
This isn’t a story about Uber being careless. It’s a story about a structural gap that no CFO team was built for. SaaS budgets were predictable: seat count × price, invoiced monthly, trivial to reconcile. Token-based AI consumption is none of those things. It scales with usage, multiplies with agentic workflows, and generates costs that engineering teams incur invisibly throughout the month. By the time finance sees the number, the spending is already done. Uber found out in April. Microsoft found out around the same time and revoked Claude Code licenses for an entire division effective June 30. These aren’t outliers. According to Ramp’s April 2026 AI Index, monthly AI token spend across enterprise customers grew 1,001% from January 2025 to April 2026. The median company now dedicates nearly 15% of its software budget to AI tools.
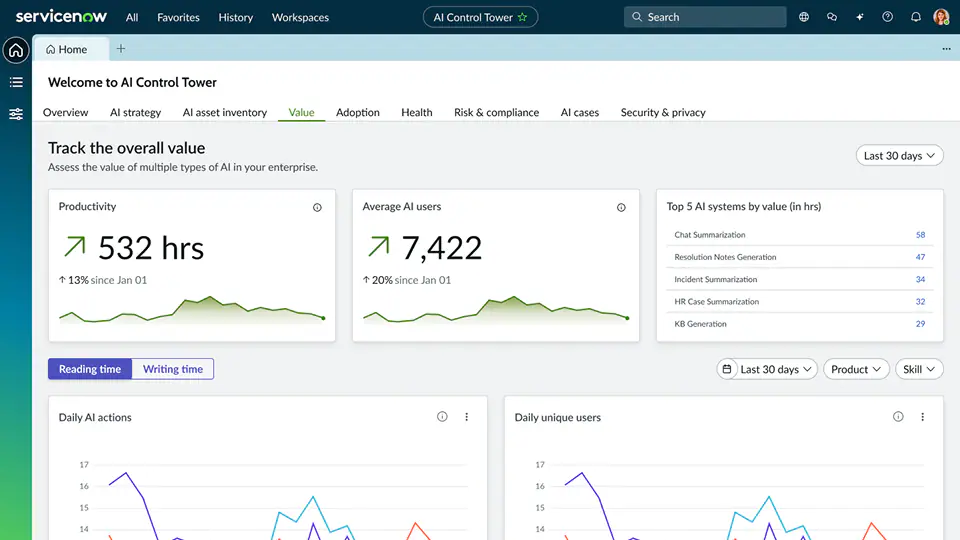
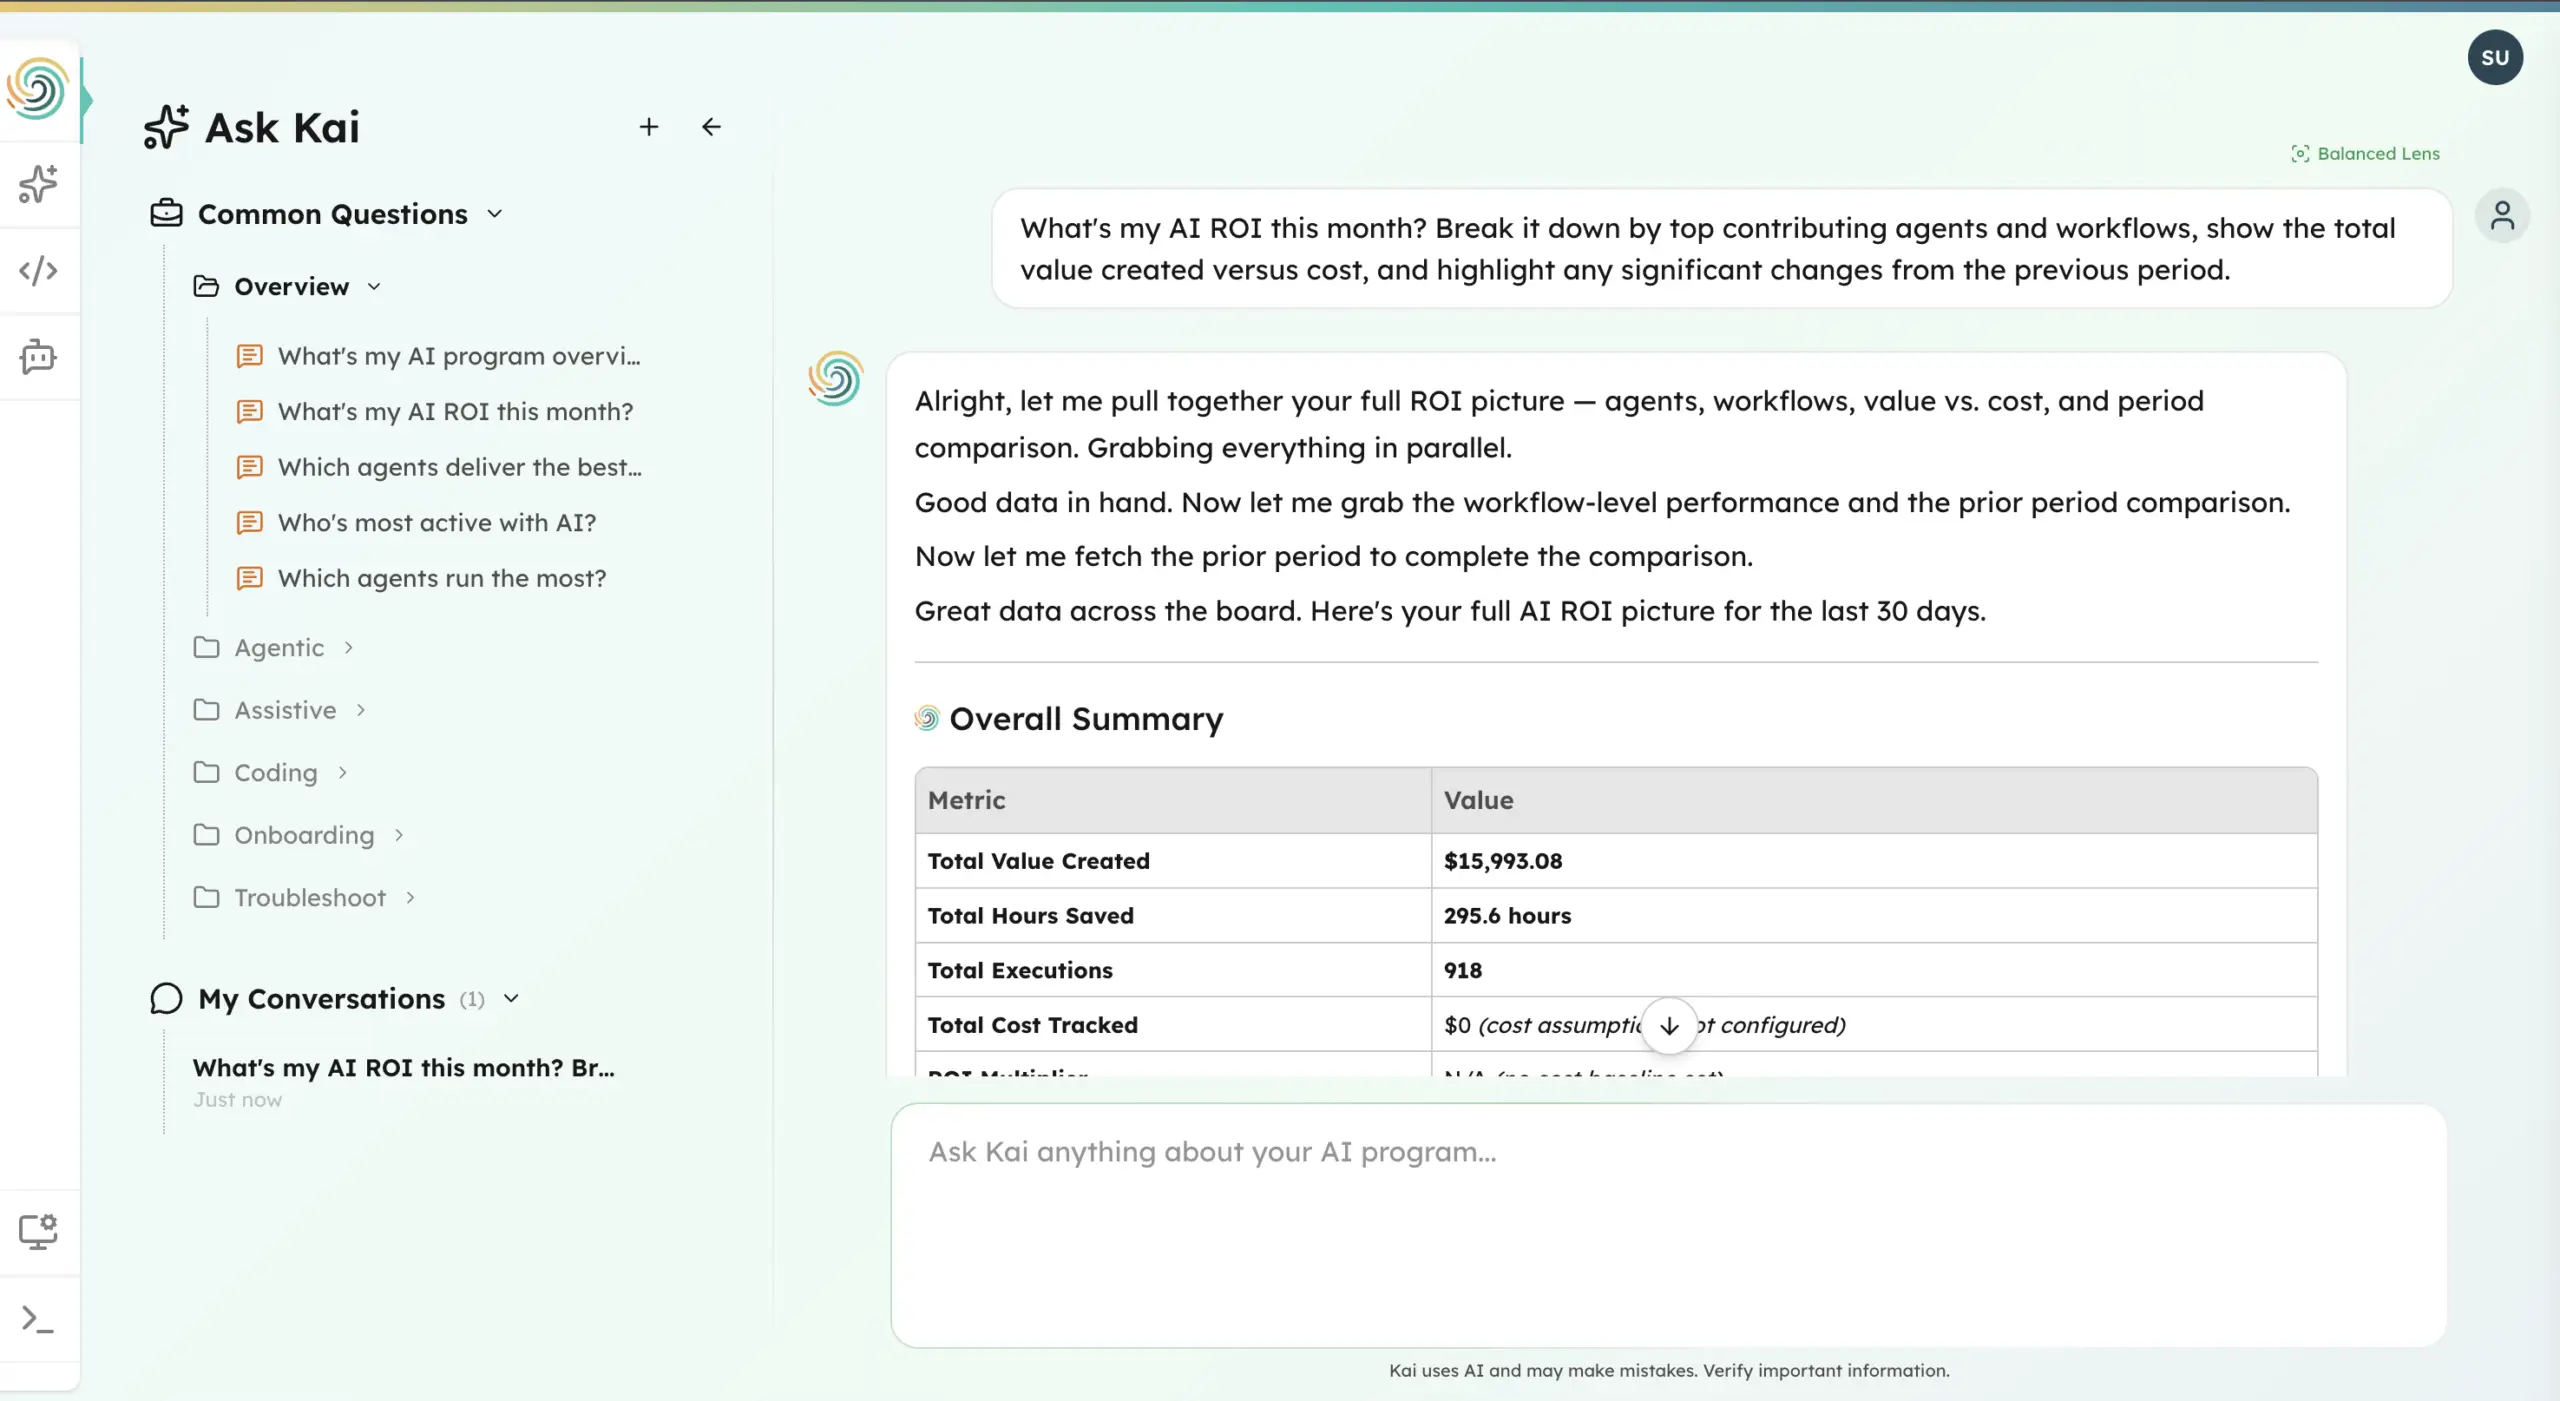
The finance operating model hasn’t caught up. Most AI monitoring tools give CFOs a token dashboard — a view of how many tokens were consumed, by which provider, at what cost. That’s a start. But it’s not a CFO metric. It’s an engineering metric dressed up for the finance team. What CFOs actually need are three different measurements, each one capturing something a token dashboard deliberately ignores.
Why This Is Different From Every SaaS Budget You’ve Managed Before
The shift from seat-based to token-based pricing is more disruptive to financial planning than it looks. Seat costs are a fixed overhead — you know the number on the first of the month. Token costs are a variable that compounds with behavior. The more your engineers use AI, the more capable and dependent they become, and the more tokens they consume. EY estimates that a standard chatbot interaction costs roughly $0.04. An orchestrated agentic workflow — where AI models call tools, spawn sub-agents, and iterate across multiple reasoning steps — costs approximately $1.20 per interaction. That’s a 30x multiplier, and it’s built into the architecture of where AI is going. Goldman Sachs projects that agentic AI adoption will drive a 24x increase in global token demand by 2030.
Meanwhile, per-developer token consumption is growing at a pace that defies normal budget forecasting. TechCrunch reported in June 2026 that per-developer token consumption has grown approximately 18.6x in nine months across enterprise organizations. A Priceline engineer burned $40,000 in tokens in a single month. An unnamed enterprise accumulated a $500M Claude bill. The Linux Foundation has responded by standing up a formal Tokenomics Foundation to create standards for AI token tracking — which is itself a signal that the industry now acknowledges cost runaway as a structural problem, not an edge case. If you don’t have the right instruments in place, you’re flying without gauges in an environment where the turbulence is increasing. Here are the three metrics that change that.
Metric 1: Cost-Per-Outcome, Not Cost-Per-Token
Andrew Macdonald’s admission — “that link is not there yet” — describes exactly what’s missing from every token dashboard on the market. They tell you what you spent. They don’t tell you what you got. And the gap between those two questions is where CFOs get into trouble. A team burning twice the tokens of the team next to them isn’t necessarily wasteful. They might be twice as productive. Or they might be prompting in circles. You cannot tell from a spend number alone, which is why cost-per-token is the wrong unit of analysis for a CFO.
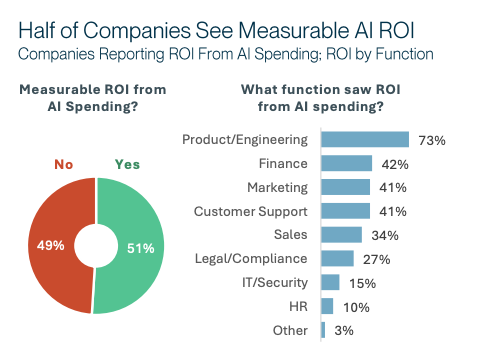
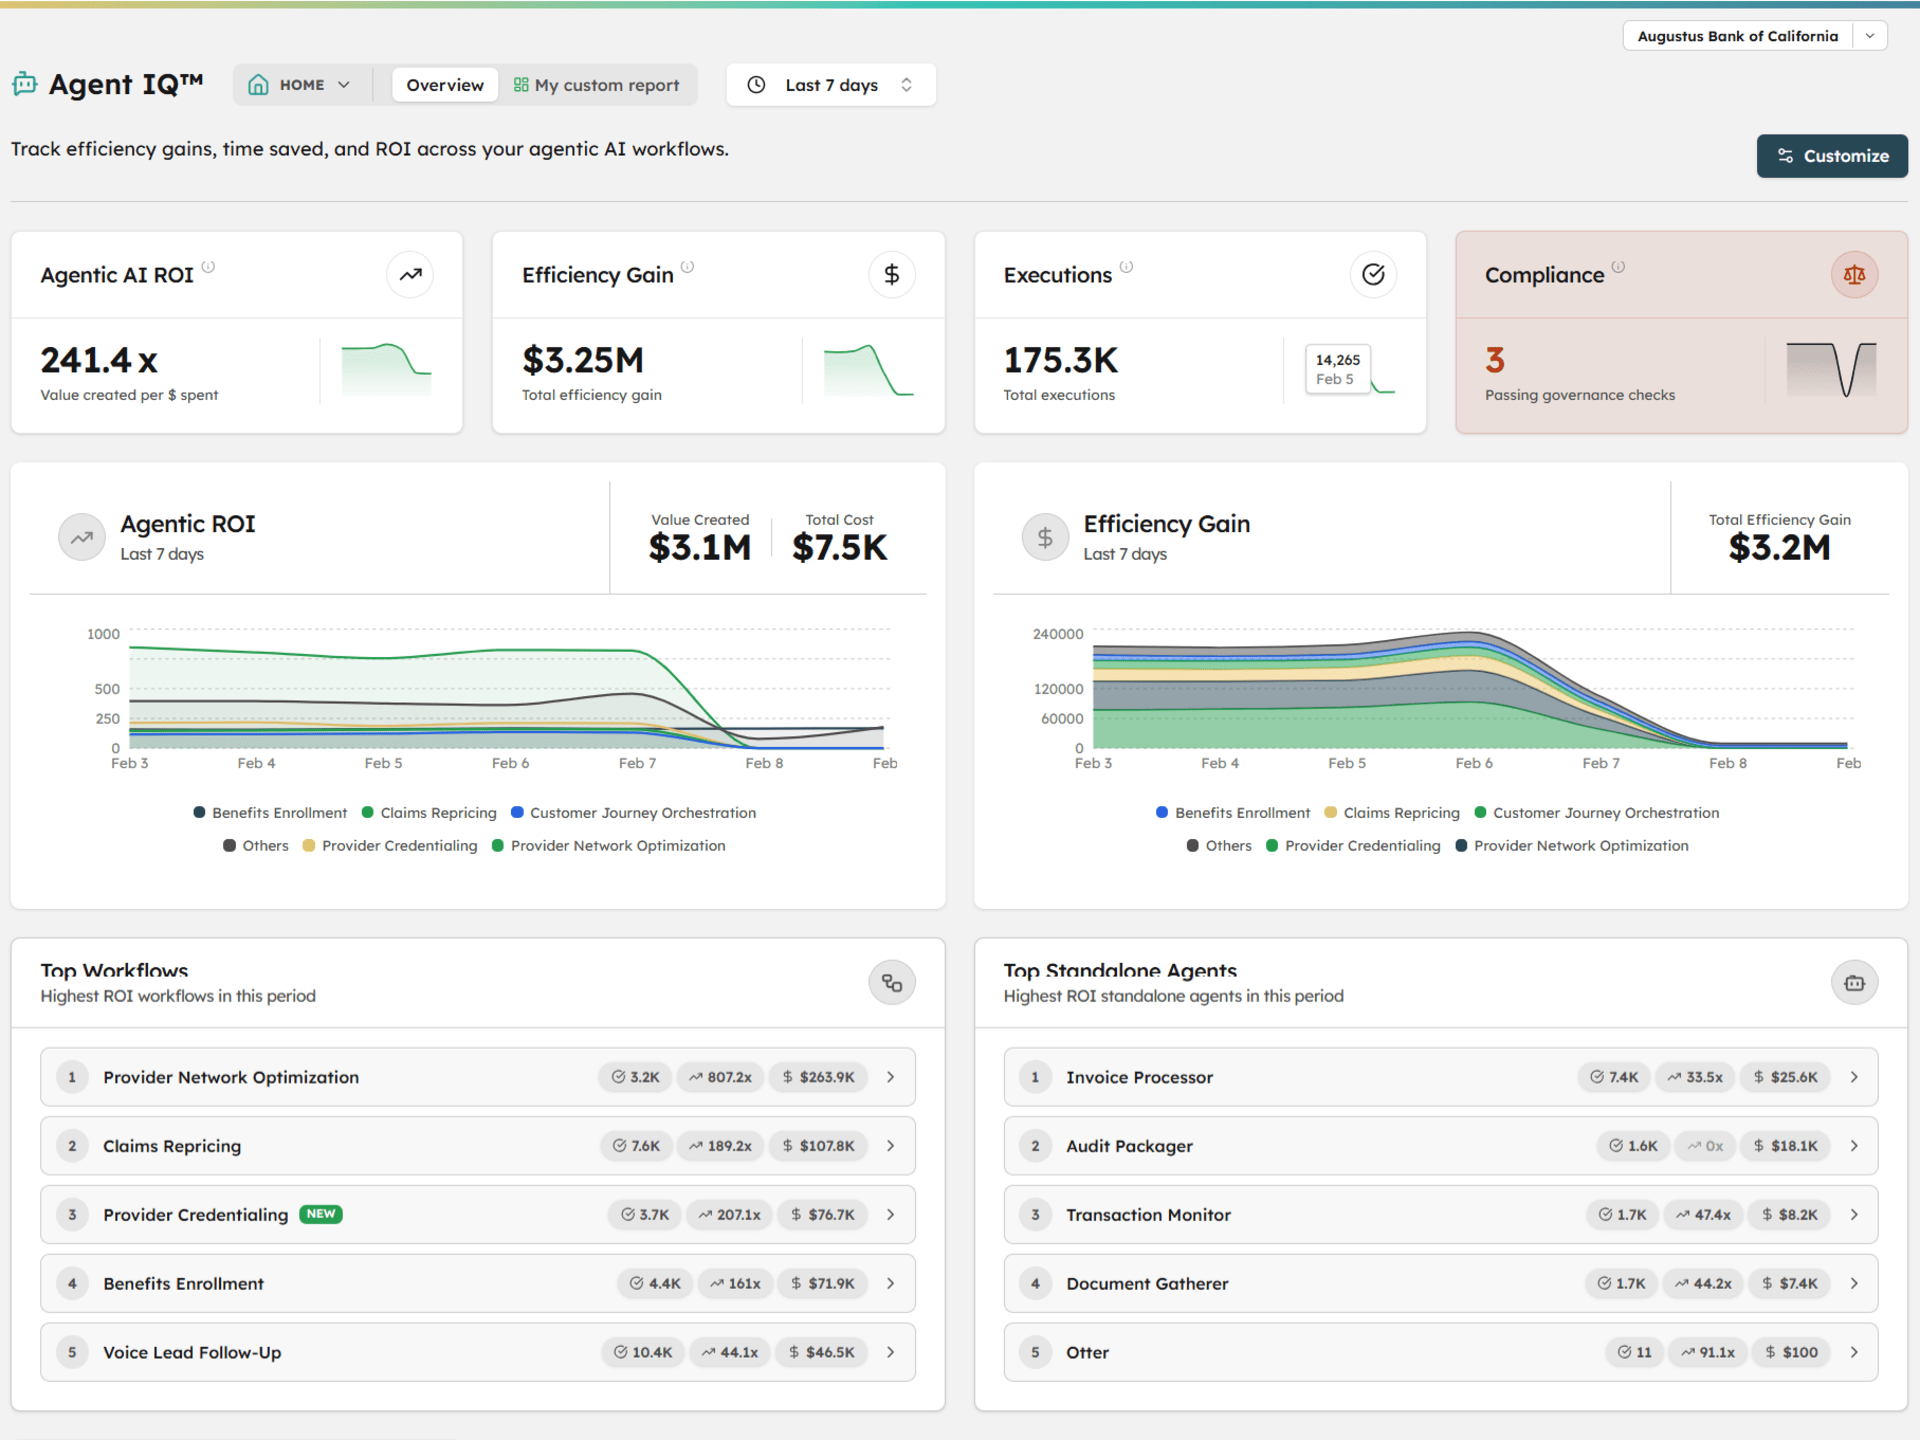
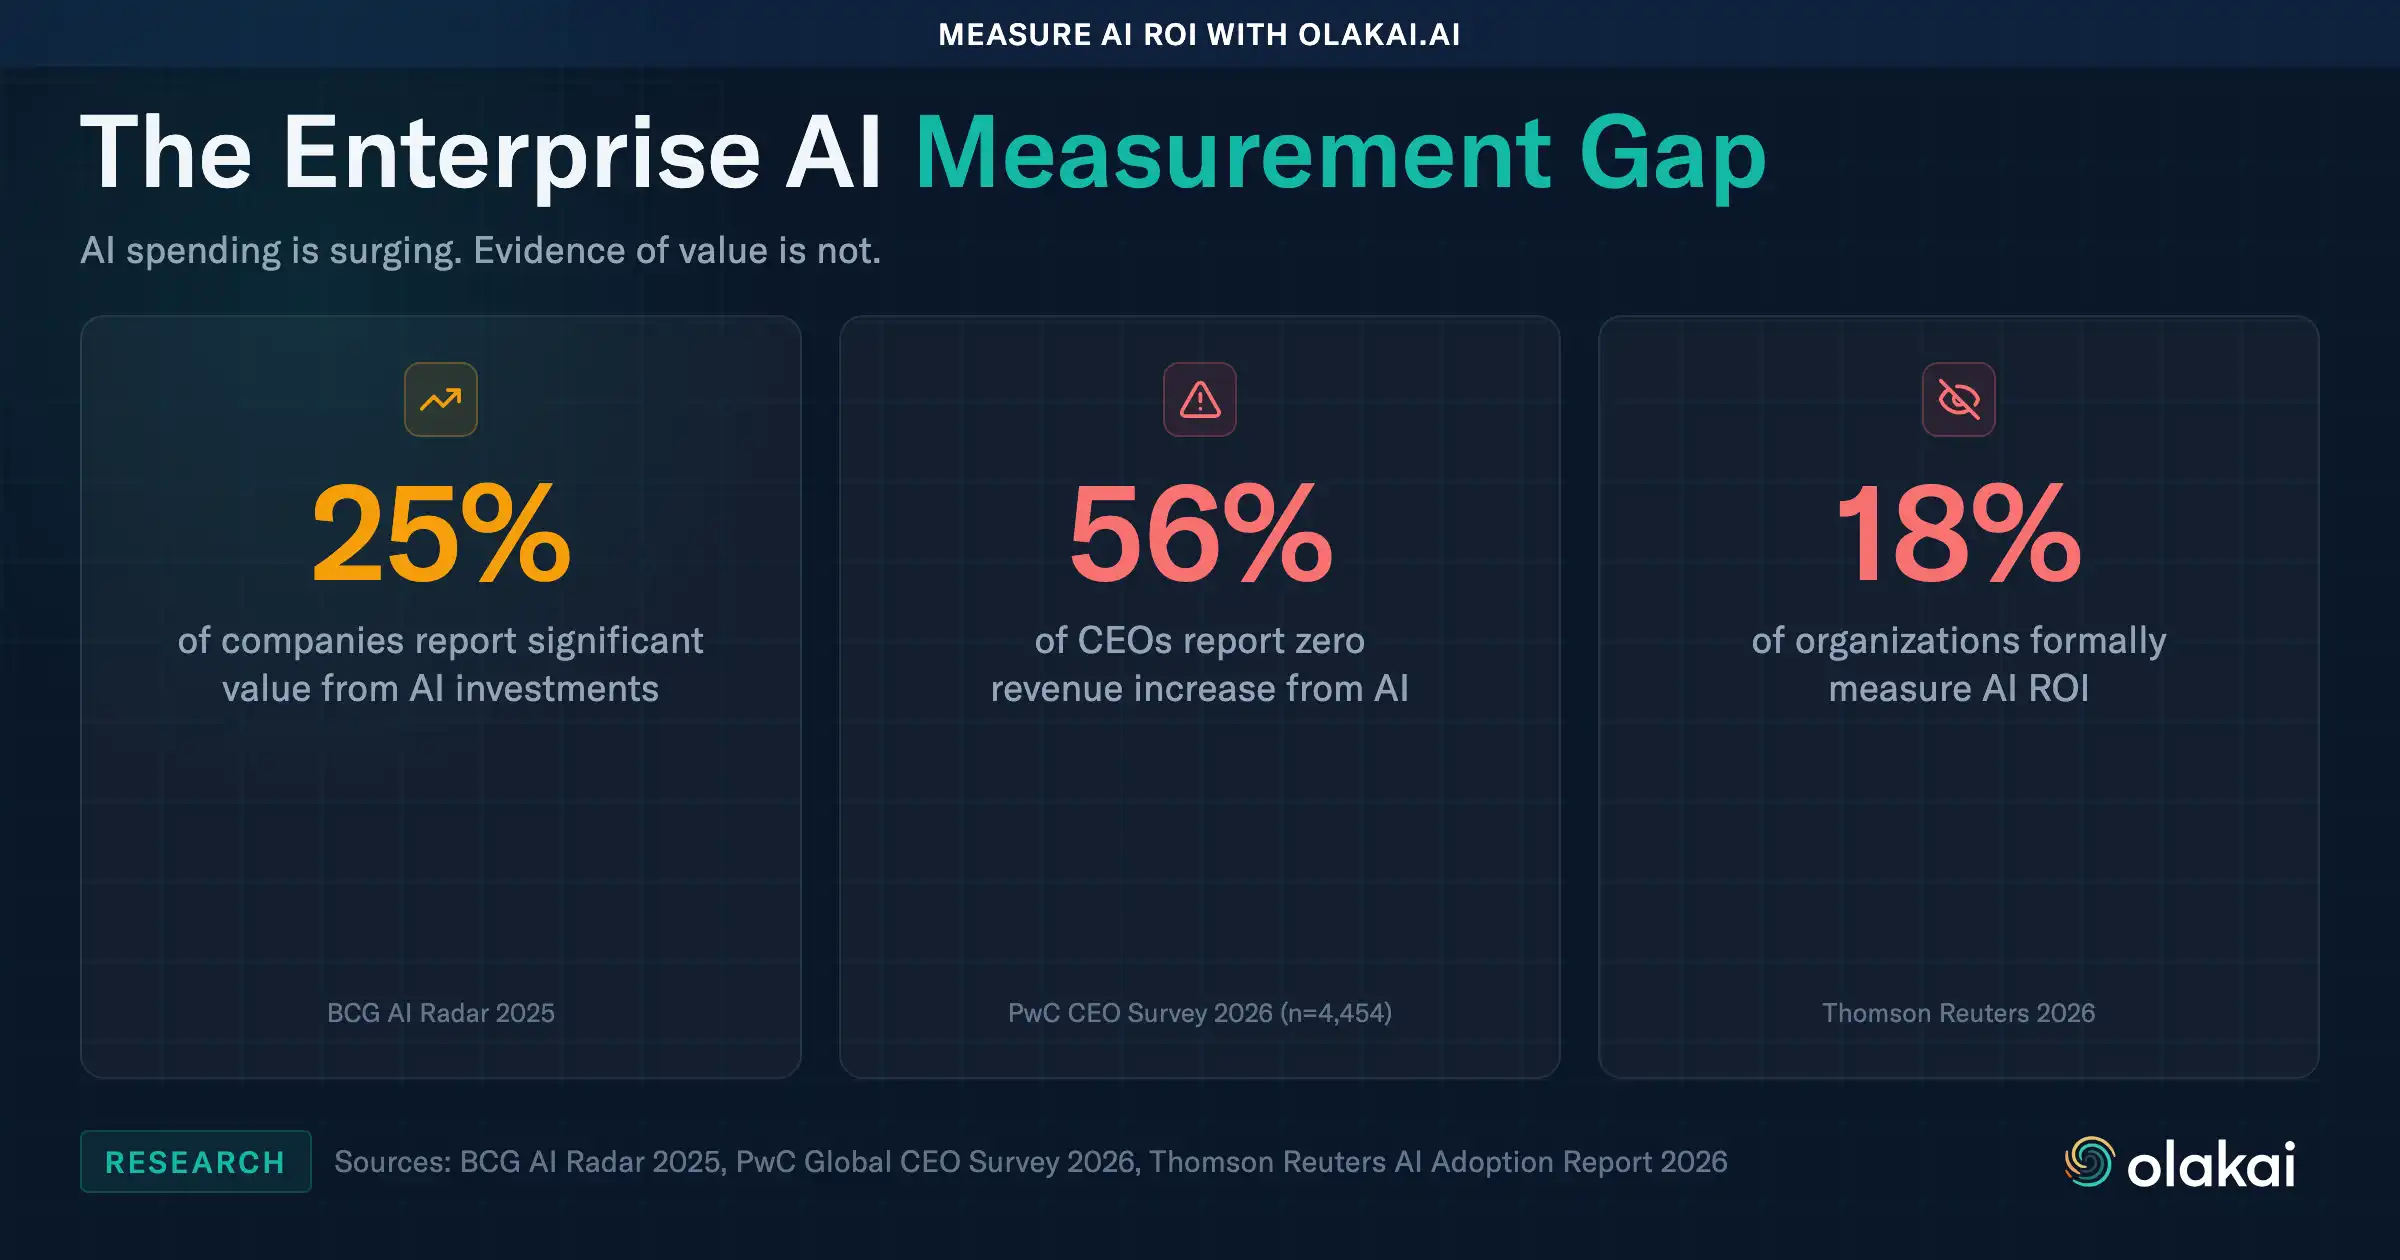
The metric that matters is cost-per-outcome: the fully-loaded dollar cost of each unit of value produced. For engineering teams, that’s cost per merged pull request, cost per deployed feature, cost per lines of production code shipped. When you measure at this level, the teams consuming the most tokens often look very different than you’d expect. Jellyfish’s research found that heavy AI users were twice as productive as their peers but consumed ten times more tokens. At the token level, they look expensive. At the outcome level, they’re your most cost-efficient engineers. Only 14% of CFOs report they’ve seen clear, measurable AI ROI (RGP, 200 US finance chiefs) — the primary reason is that they’re measuring inputs, not outputs. Cost-per-outcome is what CFOs actually need from AI measurement to make budget decisions that hold up to board scrutiny.
Metric 2: Spend Run-Rate Forecast, Not Month-to-Date Total
Month-to-date spend is a rearview mirror. By the time April’s actuals landed in Uber’s financial system, the year was already gone. What every CFO needs — and almost none have — is a forward-looking signal: at the current trajectory, when do we exhaust this budget? This is the difference between a smoke alarm and a fire report. MTD is the fire report. Run-rate forecast is the smoke alarm.
The reason this matters so urgently right now is the 18.6x nine-month consumption growth rate. Token spend doesn’t grow linearly. It grows exponentially as more engineers adopt AI tools, as those engineers use them for more complex tasks, and as agentic workflows multiply the token cost of each interaction. A budget that looked fine in January can be 40% consumed by February if adoption accelerates faster than the plan assumed. The answer is a rolling run-rate alert — a projection based on trailing consumption that fires when the month-end trajectory crosses a threshold, not when the limit is already breached. In the Uber scenario, a 7-day trailing average run-rate alert in late January or early February would have changed the conversation months before the budget was gone. Budget alerts that fire after the fact aren’t governance — they’re retrospectives. The signal you need fires while there’s still time to adjust. This is the complete AI monitoring posture that separates reactive from proactive finance teams.
Metric 3: Value Leak Rate
The Priceline engineer who spent $40,000 in tokens in one month is an interesting problem. Maybe those tokens produced something extraordinary — a complex system design, a breakthrough on a hard architecture problem, intensive research that unblocked the whole team. Or maybe that engineer was prompting in circles, getting low-quality outputs, and abandoning sessions without shipping anything. From a token dashboard, both scenarios look identical. Both show high spend. Neither reveals whether the spend connected to anything the business actually values.
Value leak rate measures the share of AI spend that doesn’t connect to a committed output: a merged PR, a deployed commit, a shipped feature. High-spend sessions that end without a commit are the signal. Not because exploration is bad — sometimes the right answer from a session is “don’t build this” — but because a high value leak rate at the account level tells you that a meaningful fraction of your AI spend is disappearing without evidence of production. The nuance matters here. Flagging every high-spend session as waste would punish your most ambitious engineers. The right instrument identifies the pattern: sessions with consistently high spend and no output, compared against a team-median baseline, tracked over time. That’s the difference between an AI visibility audit and a surveillance tool. One helps CFOs understand where the budget is going. The other just creates resentment. Jellyfish’s data — 2x productivity, 10x token cost for heavy users — makes the case for why you need this ratio, not the raw number. The ratio tells you whether the premium is justified. And if you want custom AI cost KPIs that reflect your team’s specific cost structure, the baseline needs to come from your own data, not industry benchmarks.
What Proactive Finance Teams Are Doing Now
The companies that have gotten ahead of this aren’t waiting for the annual budget reconciliation to discover they have a token runaway problem. AT&T achieved 90% cost savings in AI infrastructure after building visibility into where tokens were actually going — not by cutting investment, but by identifying the optimization opportunities that were invisible before. Kumo AI now treats per-engineer token consumption as a tracked R&D expense line, the same way they track compute or software licensing. This framing shifts the conversation from “are we spending too much?” to “are we getting R&D-quality returns on this R&D-level expense?” — which is the right question for a CFO to be asking. Gartner projects that by 2029, CFOs who implement strategic AI deployment will add 10 margin points of growth, and over 40% of agentic AI projects will be canceled before that due to escalating costs and unclear business value. The companies that add those margin points will be the ones that built the measurement infrastructure before the costs compounded. The others will be telling the Uber story about themselves in 2027.
The AI P&L is becoming a real thing inside enterprise finance. Token spend, cost-per-outcome, run-rate forecasting, and value leak rate are the line items. The CFOs who define those metrics now, build the instrumentation to track them, and establish the governance to act on them will be in a fundamentally different position than those who wait for the token dashboards to catch up. The gap between tracking spend and understanding value is the gap between a cost center and a competitive advantage. If you’re not tracking these three numbers across your entire AI stack today, talk to an expert about what it takes to get there.