
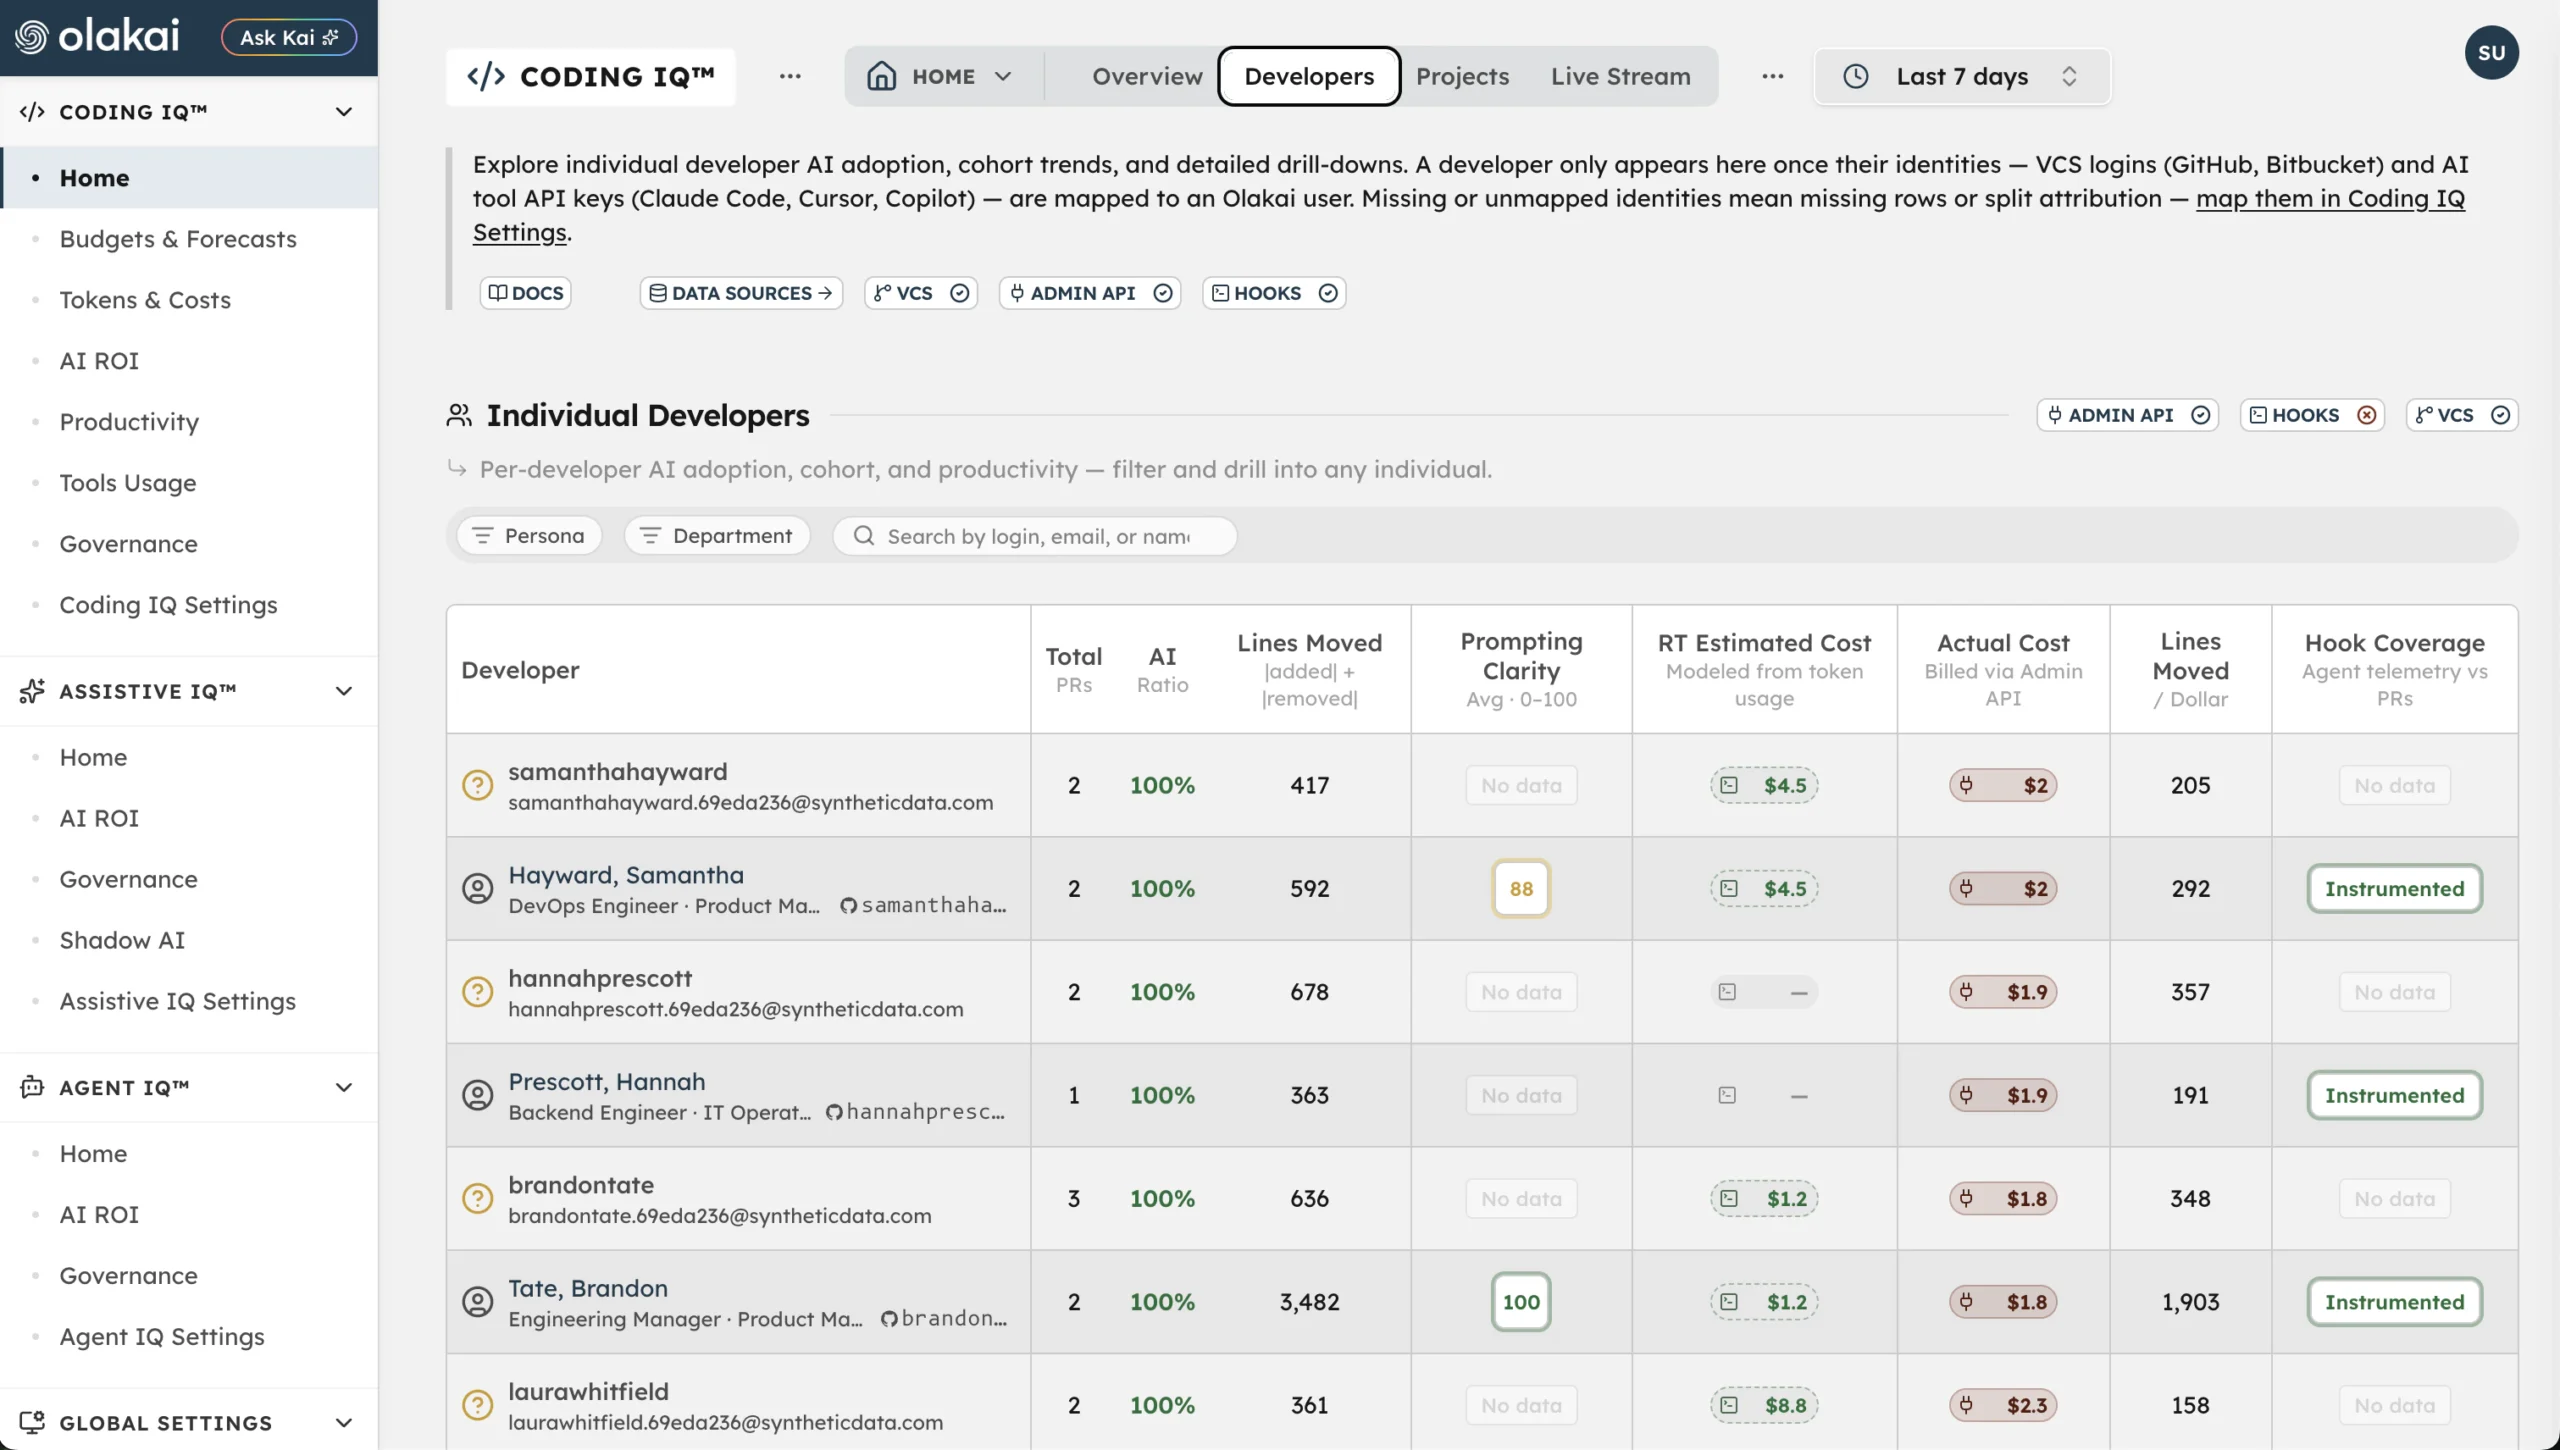

A company buys 200 seats of Claude Code or Cursor — a familiar story in the era of AI coding tool sprawl. Six months later, the adoption dashboard reports “82% activated” and everyone treats that as a win. It might be. It might also mean 40% of those developers opened the tool once, wrote one throwaway prompt, and never came back — activated isn’t the same as valuable, and a single company-wide percentage can’t tell the difference. Olakai’s adoption cohorts exist specifically to make that distinction, on the Developers tab of the AI Impact Dashboard, at the level of an individual developer rather than a rounded company average.
Four cohorts, one ratio
Every developer is assigned to one of four cohorts based on the share of their merged pull requests that show AI assistance. Power means more than 70% of their PRs are AI-assisted. Casual sits between 20% and 70%. Idle is under 20%. New is a fourth category that cuts across the ratio entirely: a developer whose first AI-assisted PR landed within the last 14 days is New, regardless of what their ratio looks like.
That last rule is a genuinely thoughtful piece of the design, and it’s worth explaining why it exists rather than just stating it. New is evaluated first and wins over the ratio bands — a developer who shipped their first AI-assisted PR this week counts as New even if literally every PR they’ve merged so far is AI-assisted. Without that override, a brand-new user’s tiny, noisy sample would misleadingly register as “Power” the moment they merged two or three AI-assisted PRs in a row, which is a worse signal than an honest “too early to tell.” The New cohort exists so the ratio-based cohorts describe settled behavior, not a small sample still finding its footing.
Cohort assignment isn’t a permanent label, either. It recomputes every time the dashboard loads, based on whatever time range is currently selected — a developer who’s New today can become Power or Casual within a few weeks as more PRs accumulate, and the cohort you see reflects the current window rather than a badge assigned once and left stale.
The table under the label
The cohort itself is a starting point, not the whole answer — the per-developer table underneath is where a specific, defensible decision actually gets made. Each row shows total PRs in the selected window, AI ratio, lines moved, a 0-100 prompting-clarity score, real-time estimated cost against actual billed cost from the Admin API, lines moved per dollar, and hook coverage — how much of a developer’s agent telemetry is actually showing up against their PR activity. That last column matters more than it sounds like it should: a developer who looks Idle by PR ratio but has strong hook coverage and heavy agent usage that just hasn’t produced a merged PR yet is a different conversation than a developer who’s genuinely not using the tool at all.
This is the layer that turns “adoption is low” from a vague, company-wide complaint into a specific, actionable list. An Idle developer with a paid seat isn’t an abstraction — it’s a named line item a VP of Engineering can pull up, with real usage data attached, and act on directly: re-train, reassign the license to someone on the waitlist, or have an honest conversation about whether the tool fits how that person actually works. None of that is possible from a single “82% adoption” slide.
The license-waste math, made concrete
Run the numbers on that 200-seat example: at even a modest per-seat price, a company with 40 genuinely Idle developers — not just under-adopting, but under 20% AI-assisted with no meaningful hook coverage either — is paying full price for licenses nobody is using. That’s not a governance abstraction or a productivity-culture problem to solve with a training session no one attends. It’s a specific, controllable line item that shows up the moment someone actually looks at the cohort table instead of the headline adoption percentage, and it’s exactly the kind of finding that turns into a real budget conversation rather than a vague resolution to “drive more adoption” next quarter.
Adoption cohorts sit next to a related, deeper diagnostic worth knowing about even if it’s a separate feature: each developer’s detail page includes a Fluency tab reporting on their specific AI fluency dimensions and where they have room to grow, which goes further than the cohort label alone when the goal is coaching rather than license reallocation.
The underlying value here is the same thread running through the rest of Olakai’s AI coding analytics: a business-friendly interface that turns raw Git activity into a decision a non-engineering manager can actually act on, rather than a chart that requires an engineer to interpret before anyone can use it.
Curious how many of your own AI coding seats are Power, Casual, New, or genuinely Idle? Talk to an Expert.