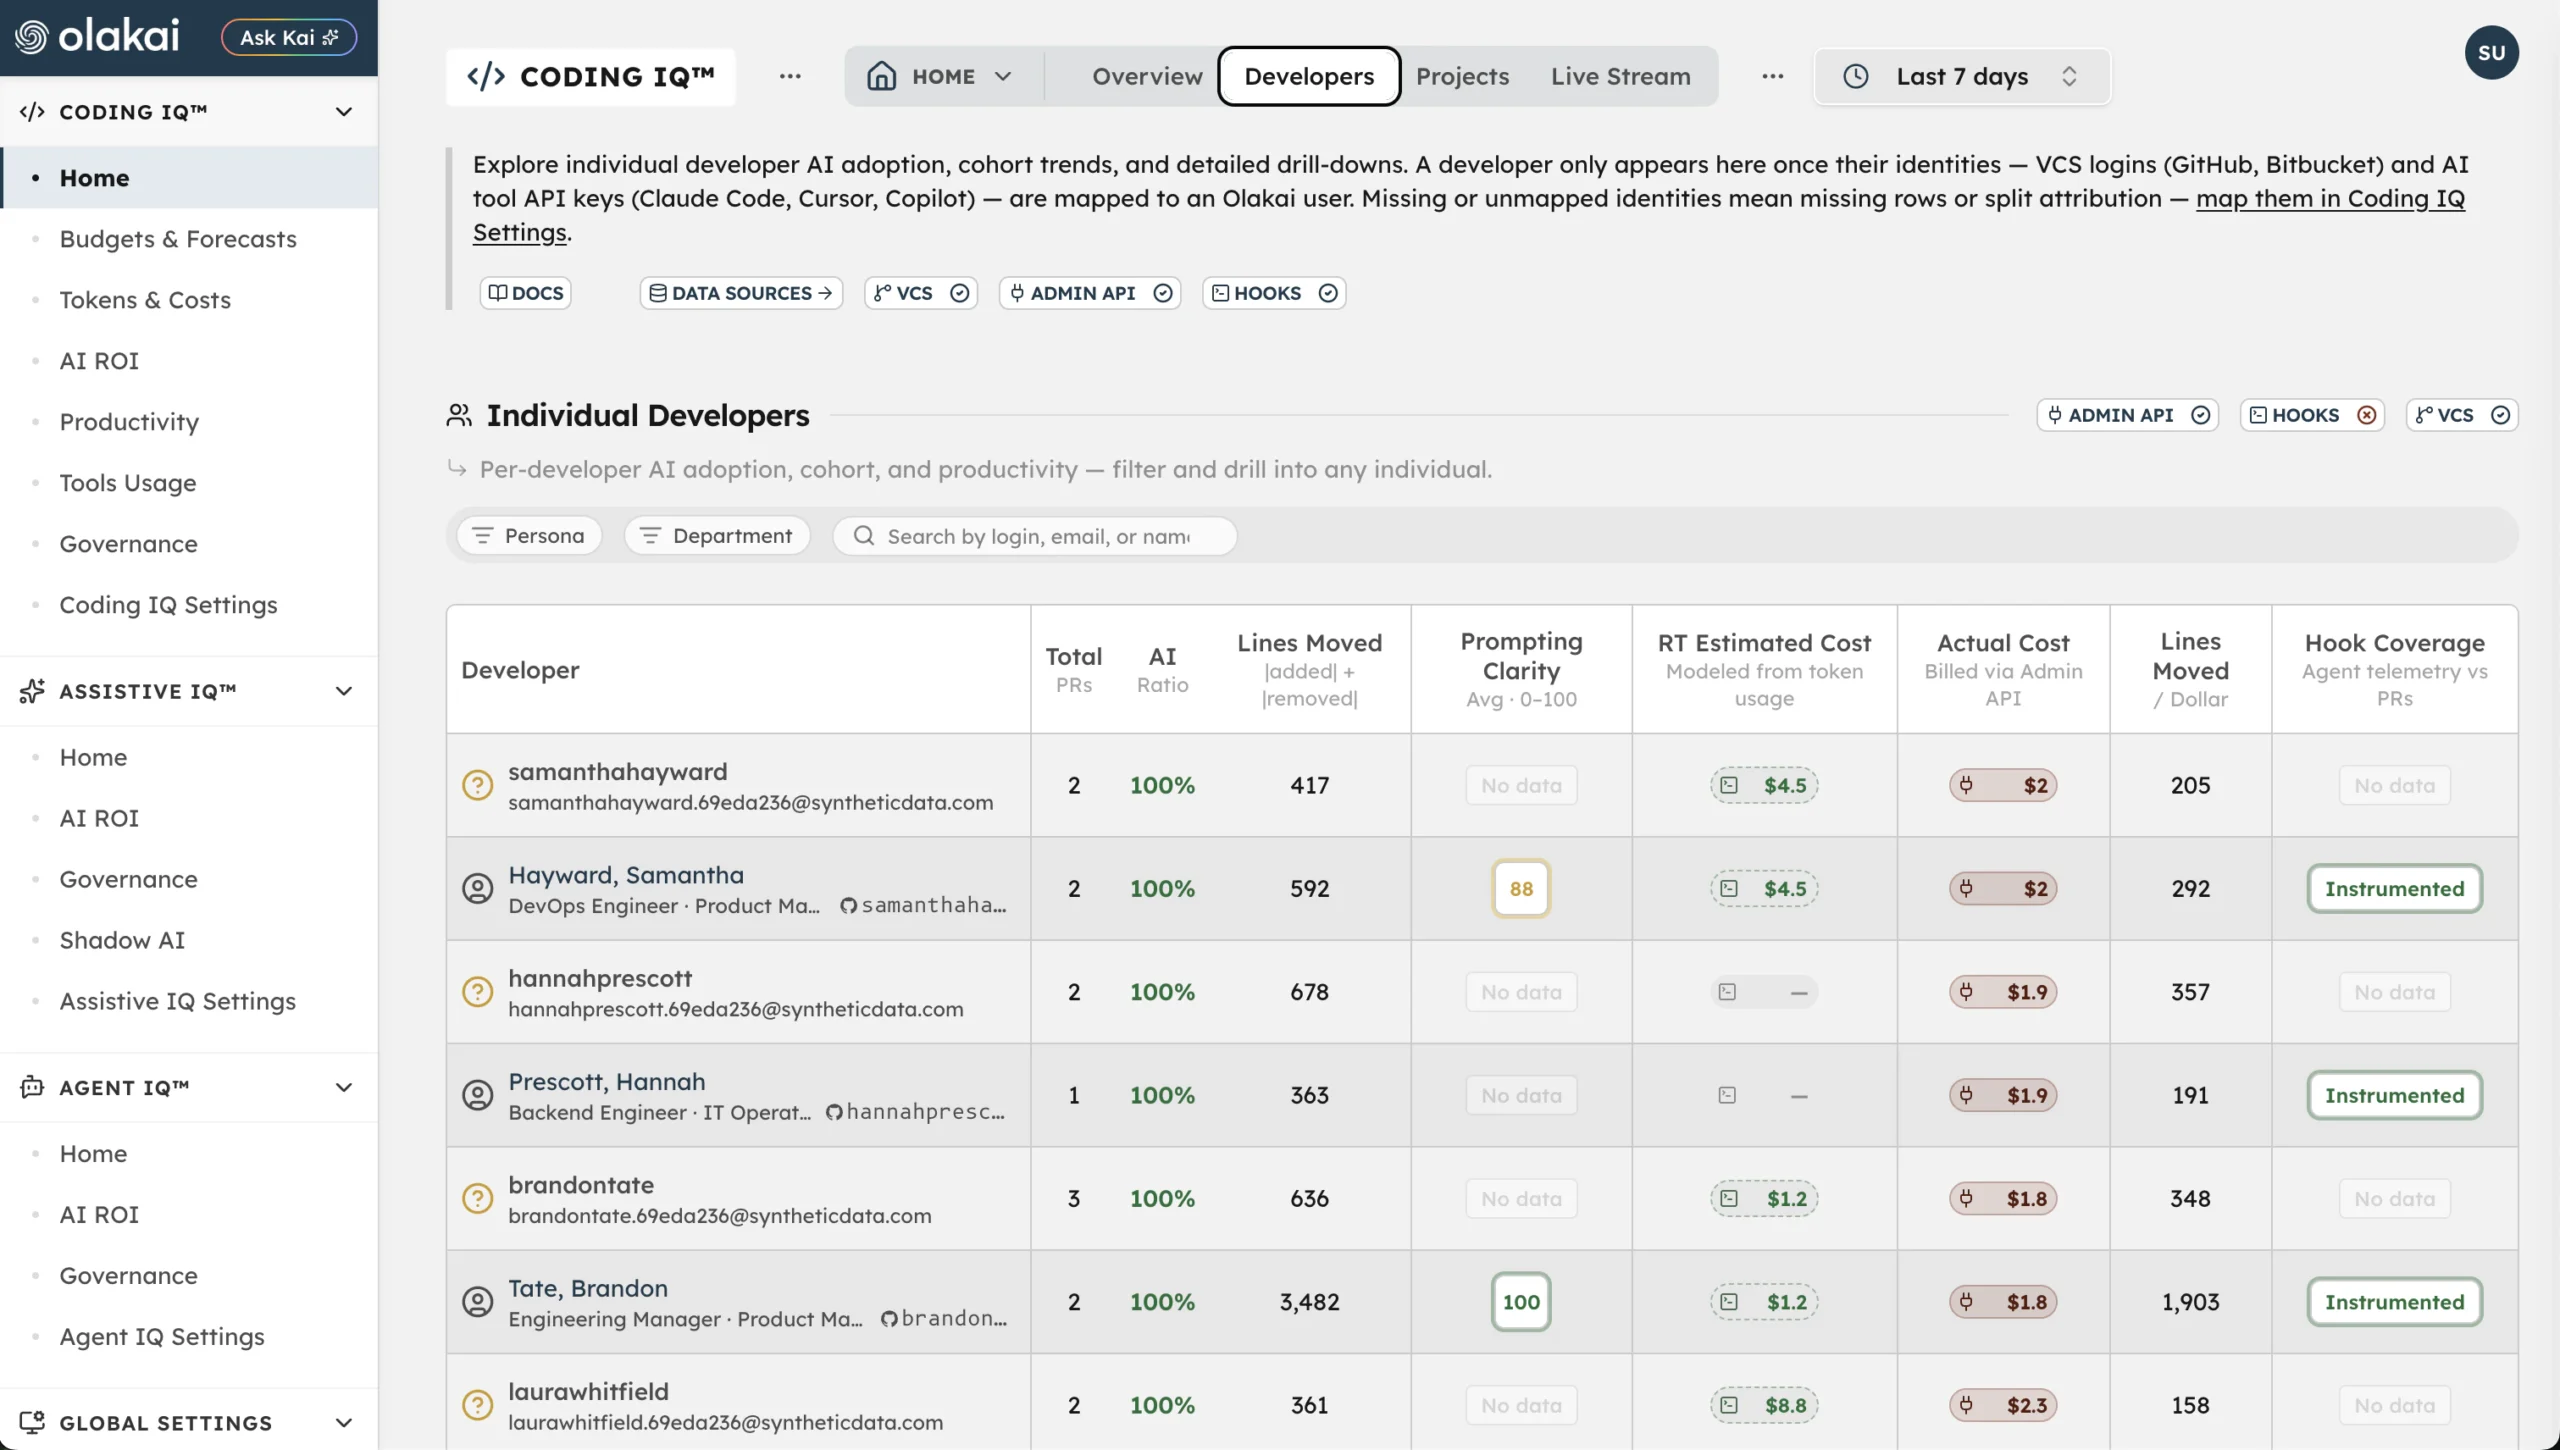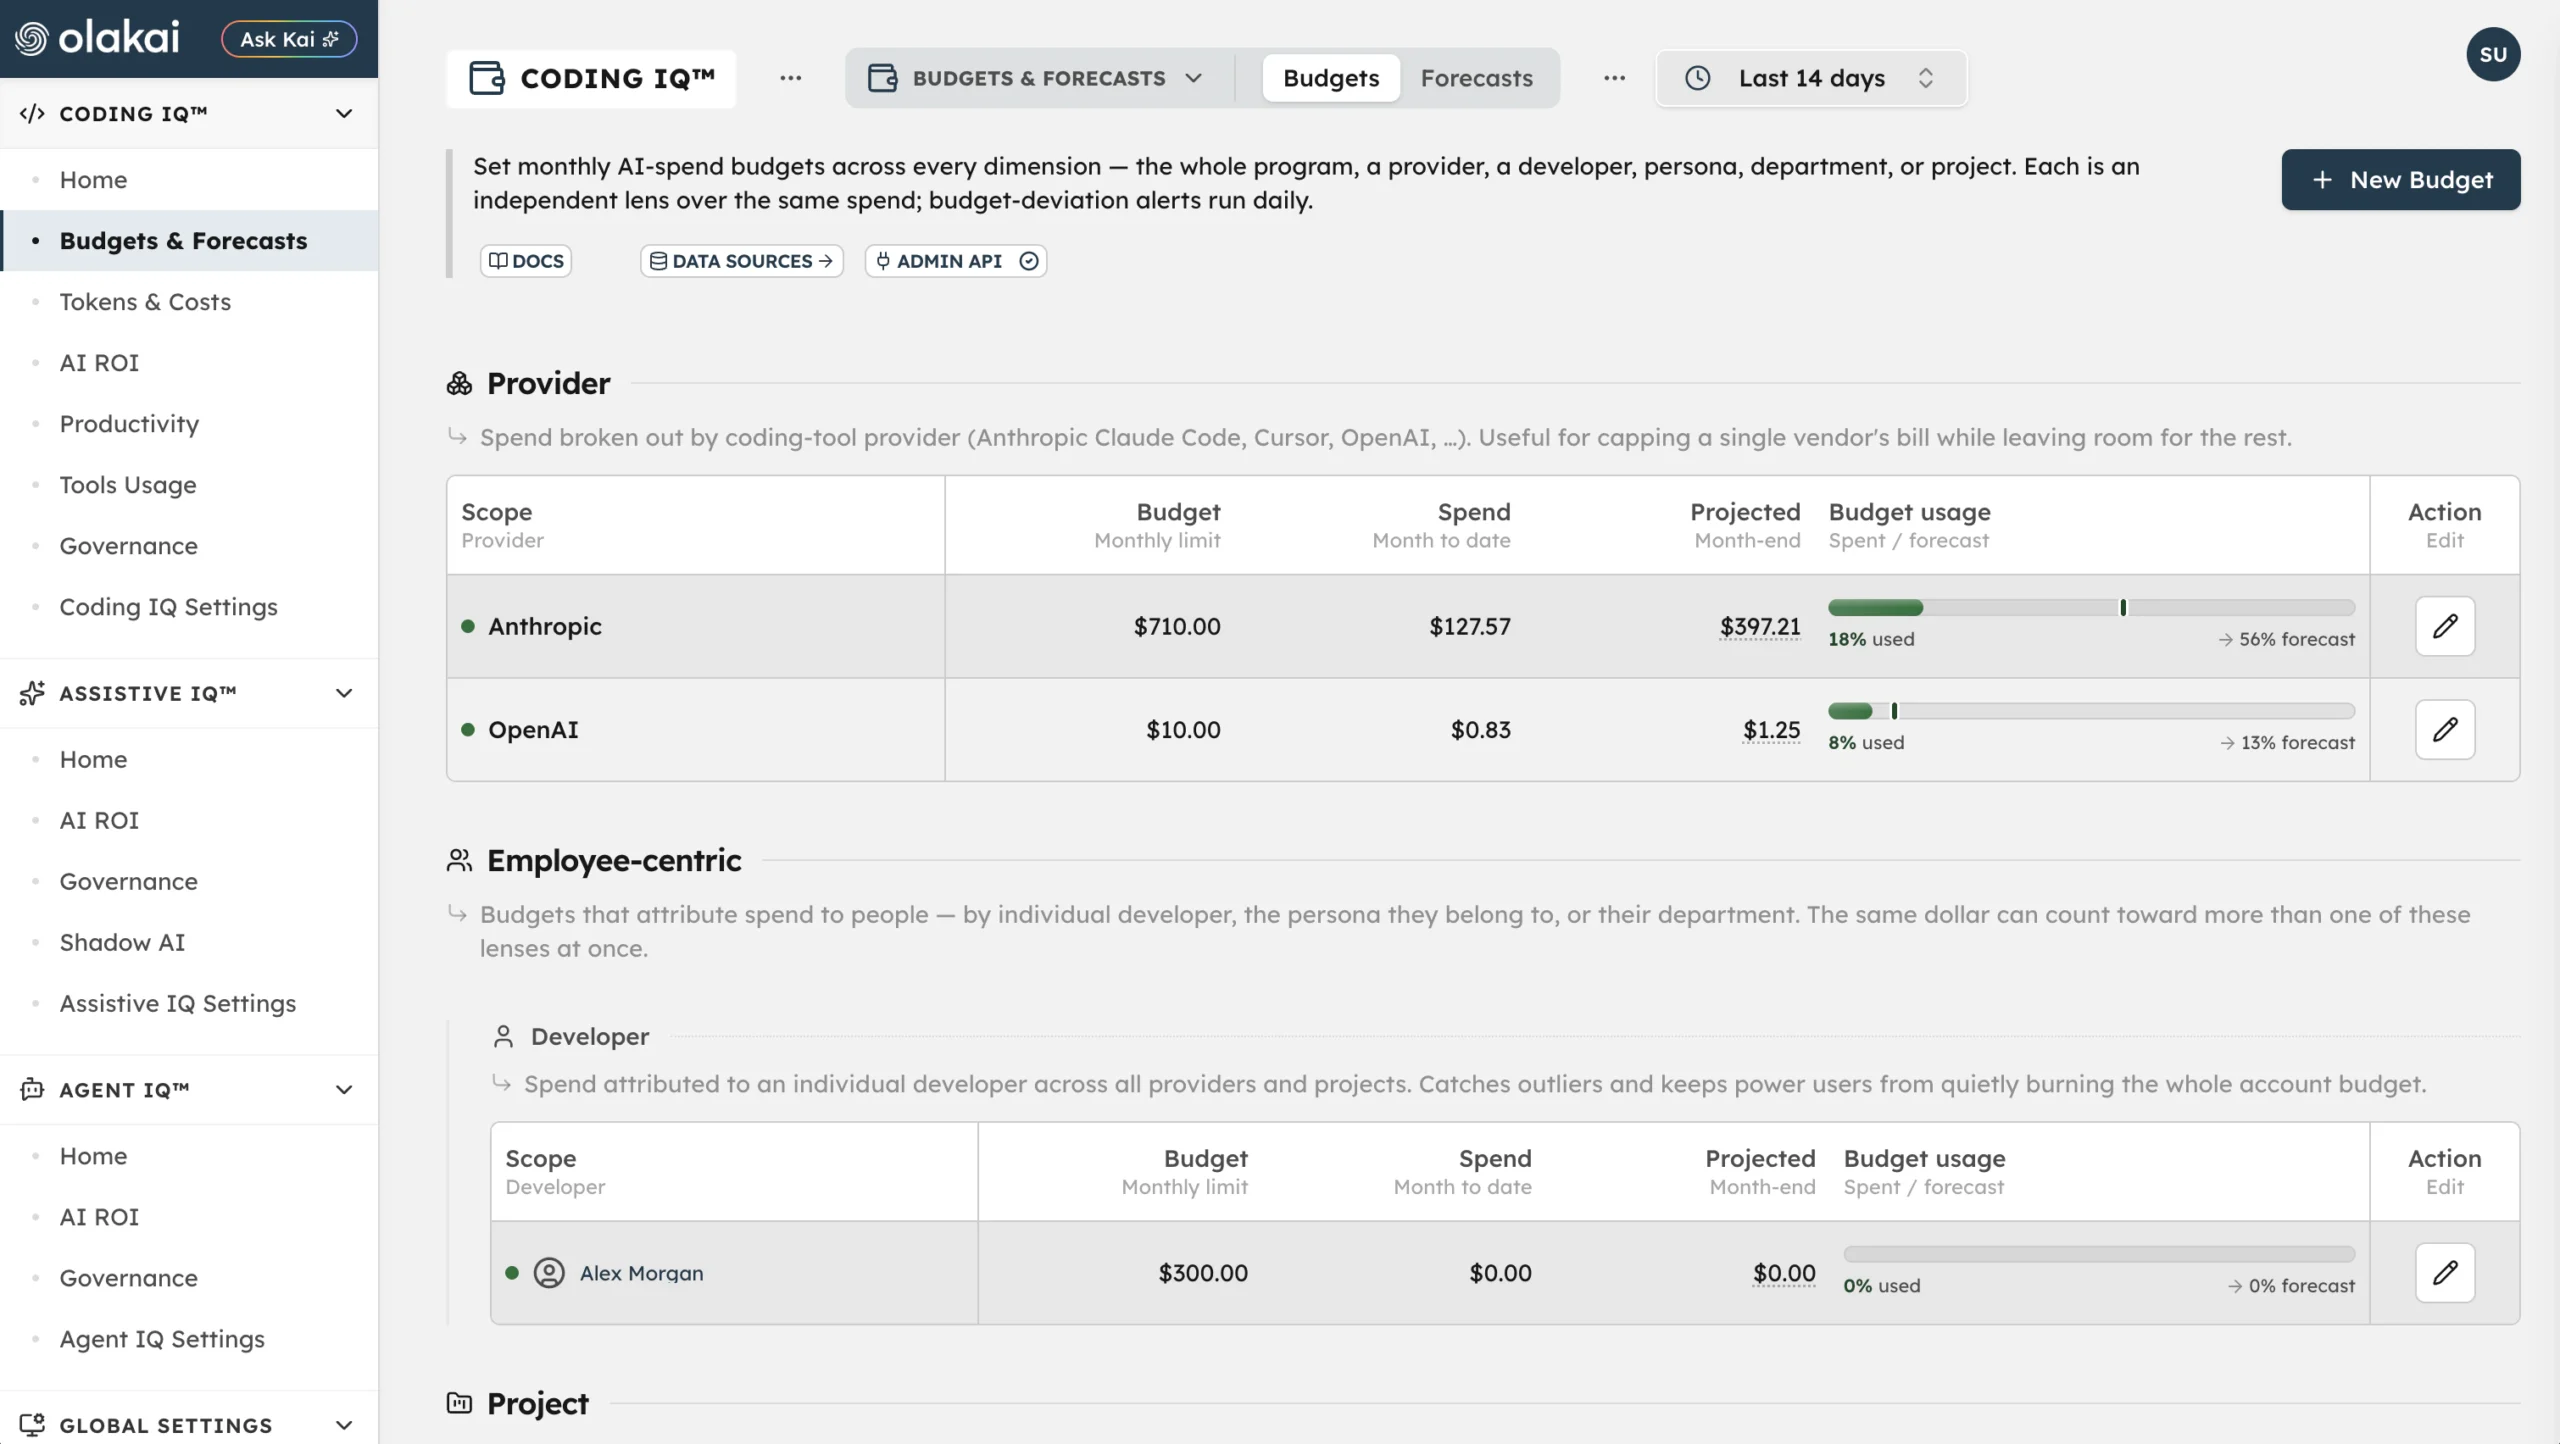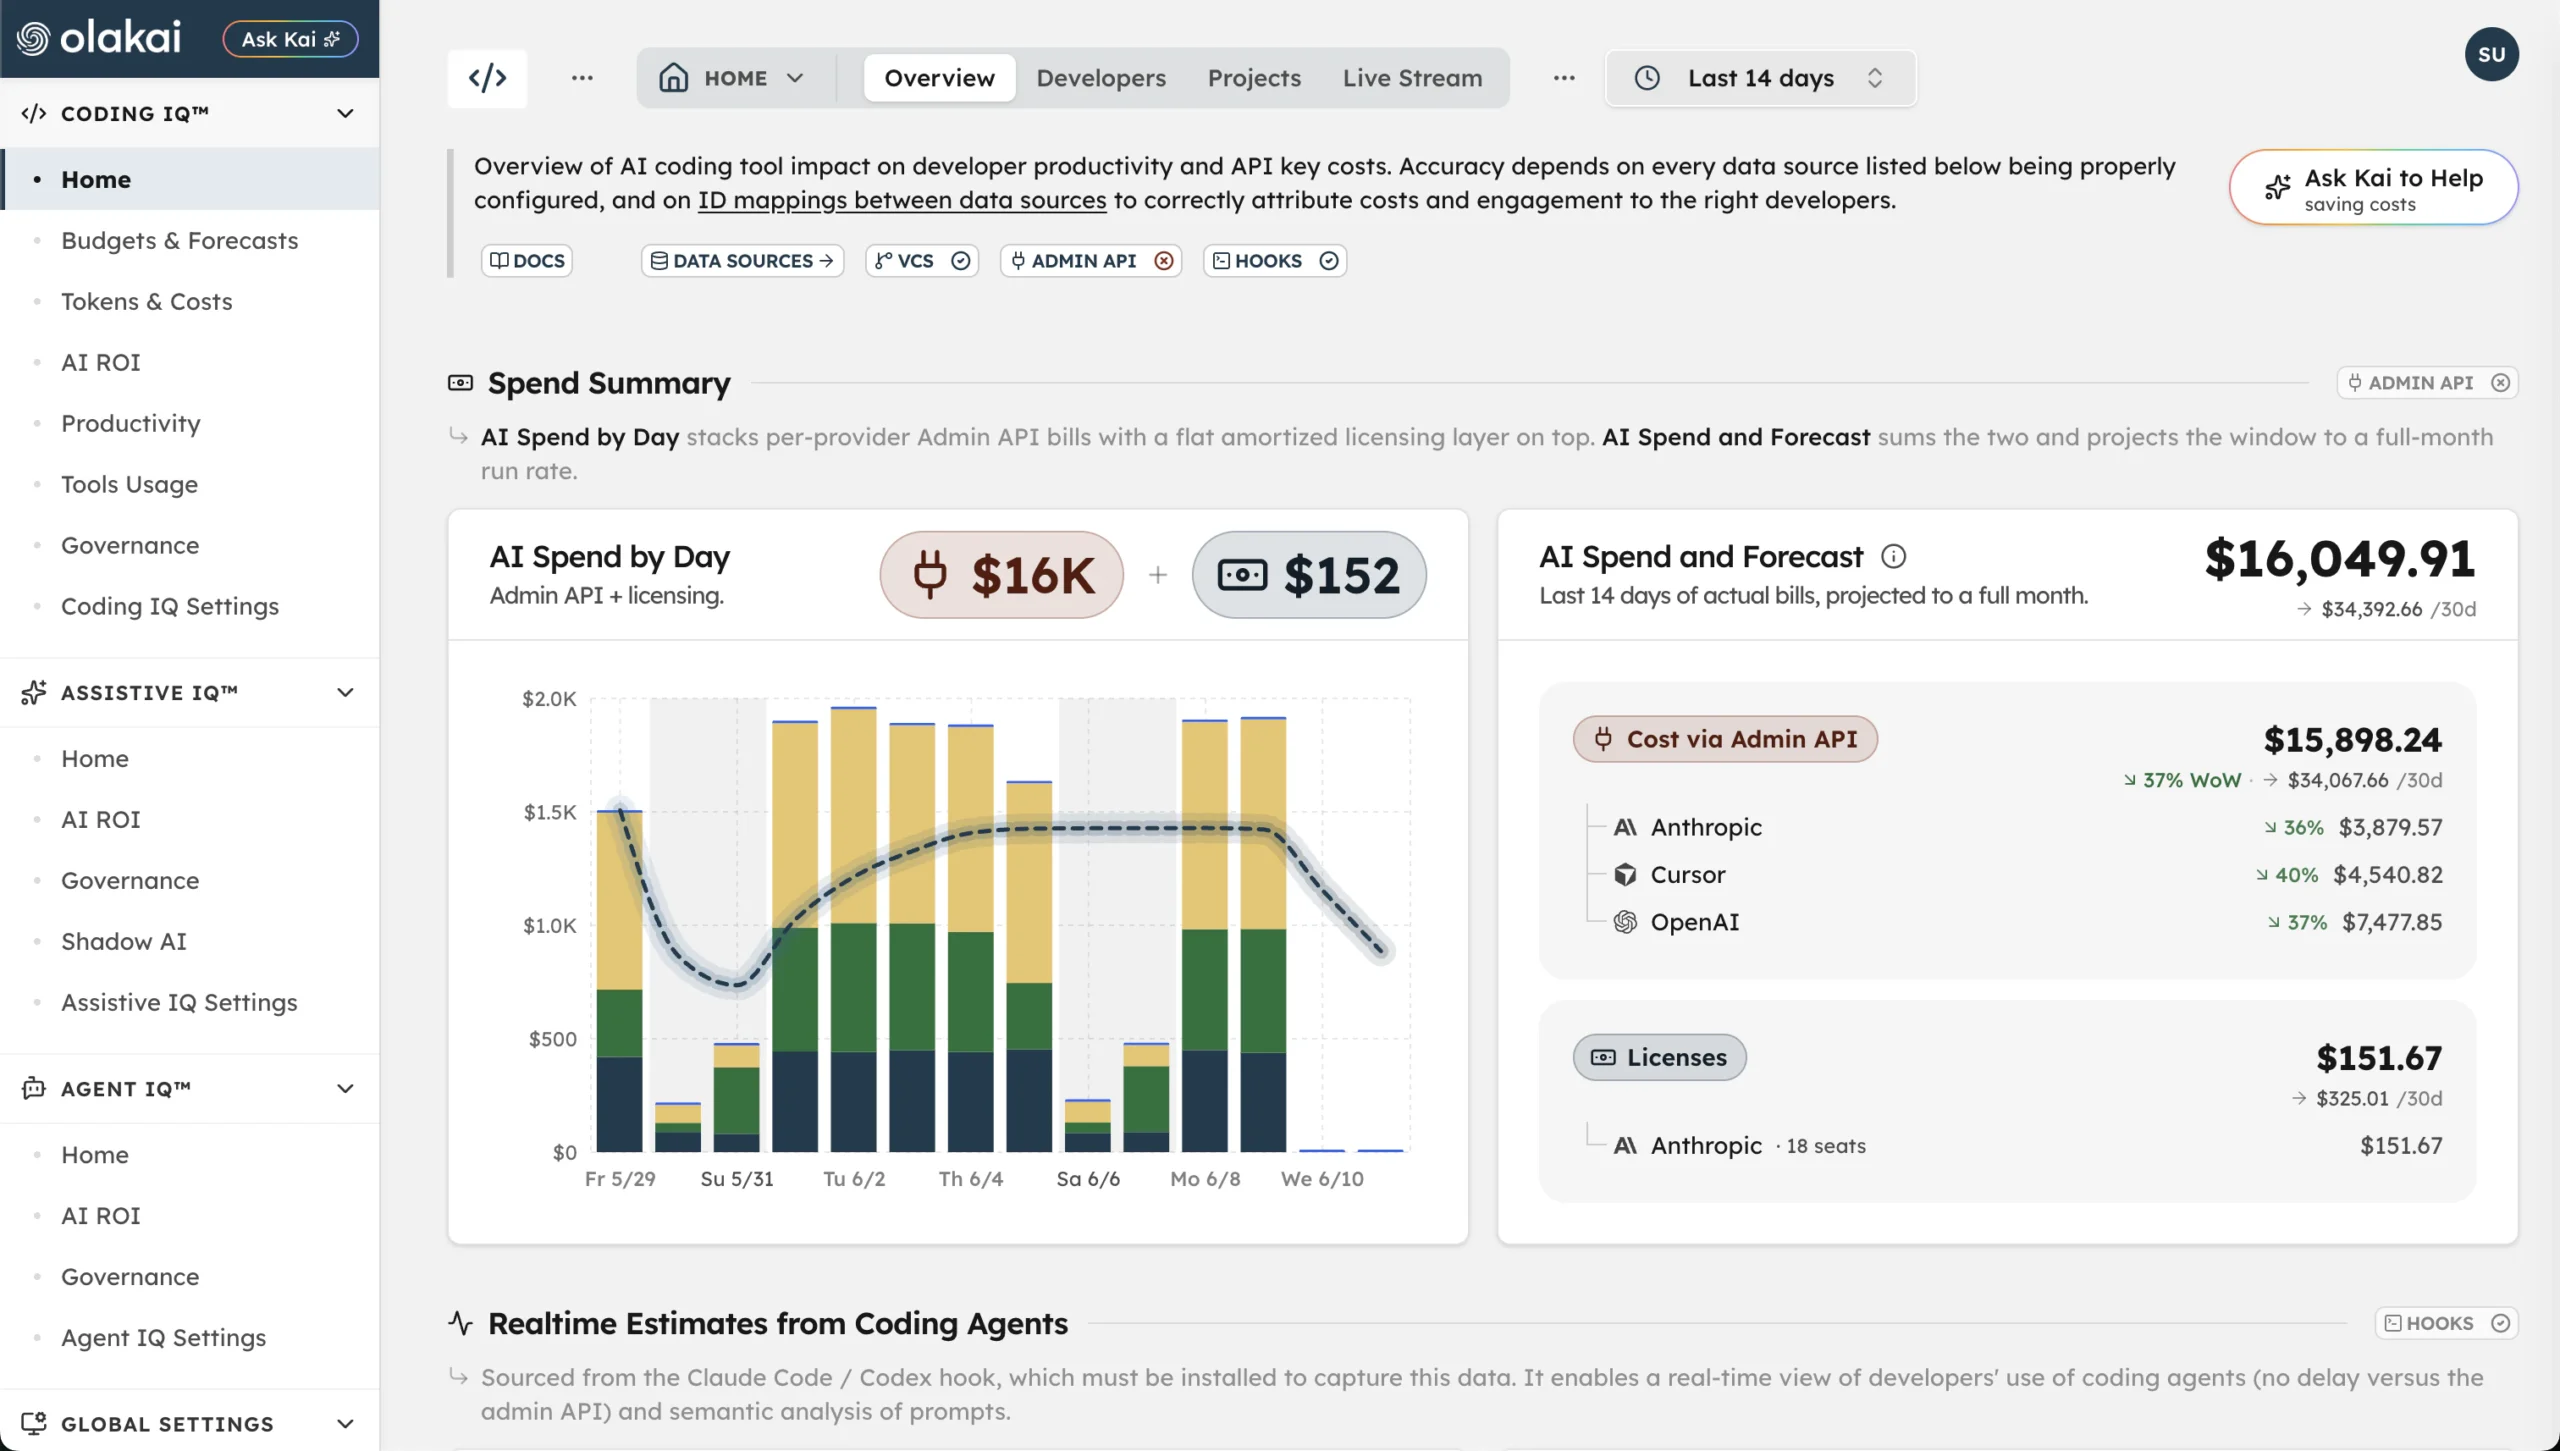
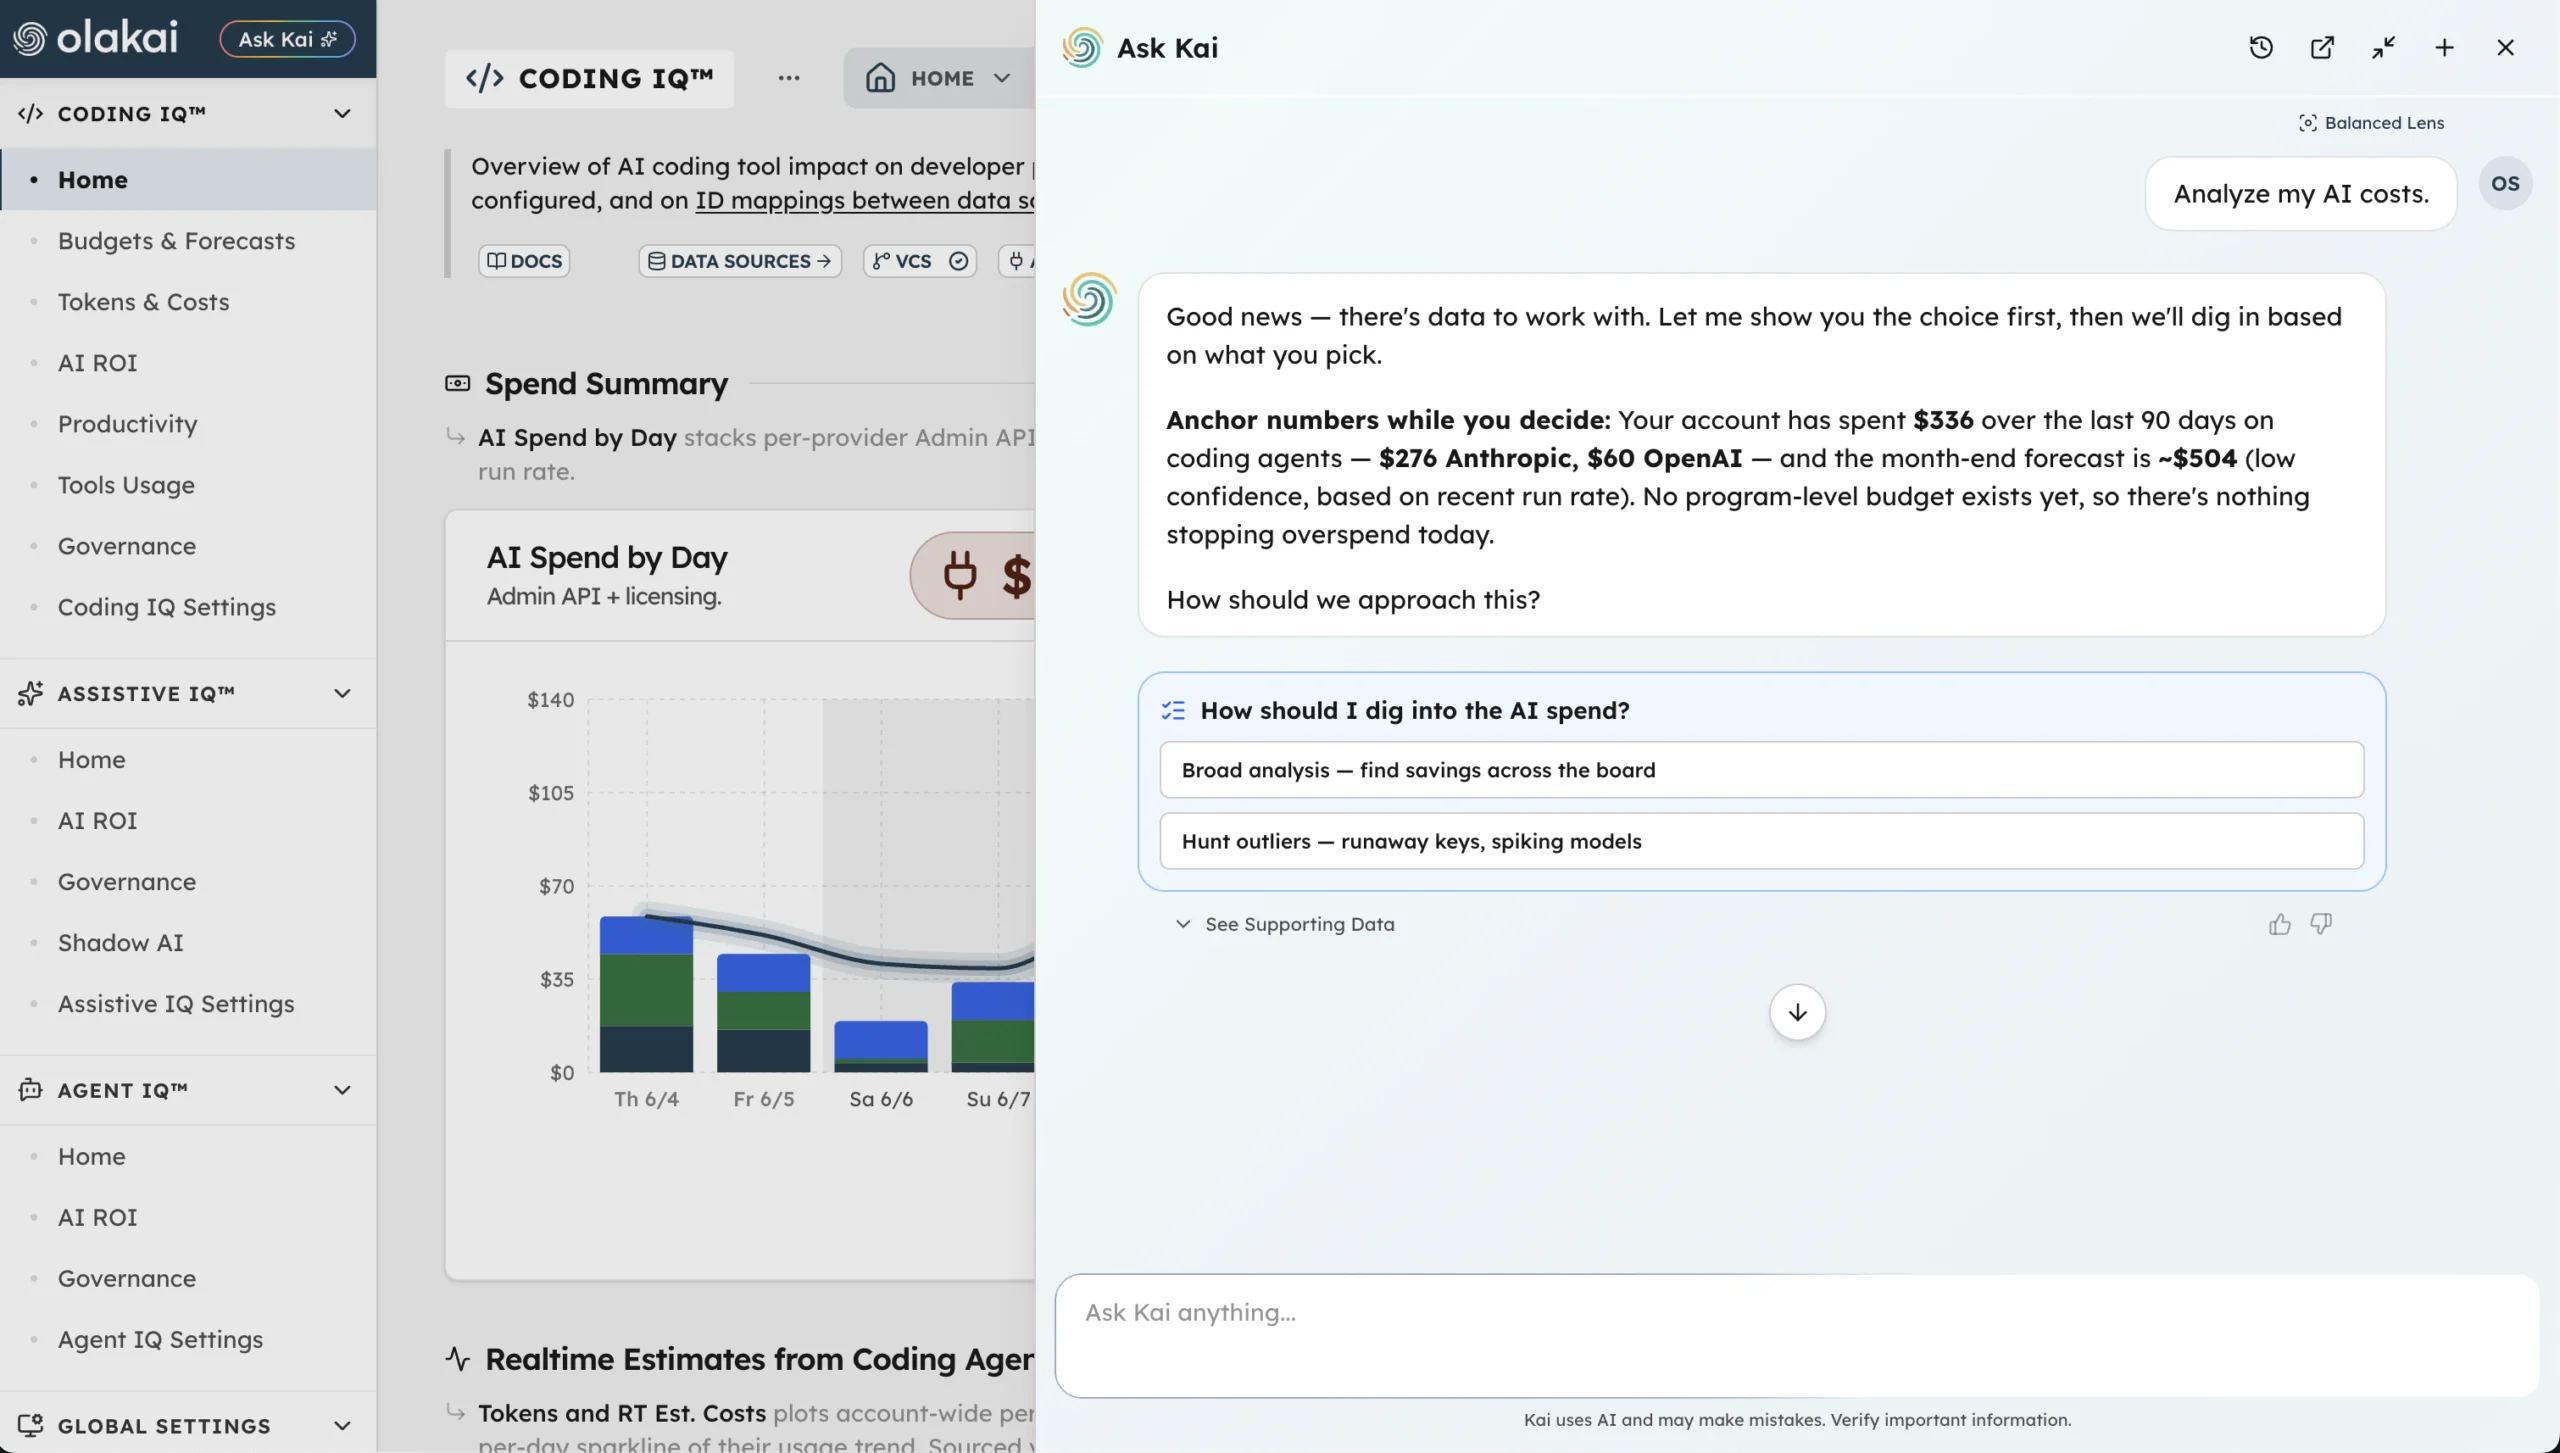
Most AI coding-cost dashboards show a number and let you assume it’s a bill. Sometimes it is. Sometimes it’s a model built on token counts and a price sheet, dressed up to look exactly as confident as a real invoice. For a CFO signing off on a growing AI coding spend line, that distinction is the whole ballgame — and it’s one most AI analytics platforms don’t bother making. Olakai does, and Google Vertex AI is the clearest example of why it matters.
Usage is real-time. Cost isn’t — and the product says so.
Vertex AI token usage syncs into Olakai in real time — every request, every token, visible almost as soon as it happens. Cost is a different story. Google’s Cloud Billing export into BigQuery, which is what Olakai reconciles against for the real, billed dollar figure, typically takes 24 to 48 hours to catch up. Until it does, the Total Cost stat card, the Cost by Model breakdown, and the Cost by Developer table on the Vertex page all read $0 or an explicit “No cost data yet” — and the page carries an inline notice above the summary cards saying exactly that, not a footnote buried in documentation. Recent spend reads low for a day or two, on purpose, because the alternative is guessing.
That’s a real tradeoff, not a cosmetic one. A dashboard that always shows a confident-looking cost number, updated in real time, is easier to build and easier to demo. It’s also wrong for the most recent day or two of every reporting period, every time, without telling you. Olakai’s Vertex integration chose the less flattering, more accurate option: token usage updates immediately because it’s genuinely known immediately, and cost updates only once it’s genuinely known — reconciled to Google’s actual bill via the Cloud Billing → BigQuery export, not modeled from a public price sheet.
Three providers, three different honesty postures
Vertex isn’t the only provider with a gap between what’s easy to show and what’s actually true — it’s just the most transparent about it. Anthropic and Cursor’s cost data comes straight from their Admin APIs in real time, with no lag at all; what you see is what’s billed, as soon as it happens. OpenAI’s Admin API has a different limitation entirely: it doesn’t expose a user dimension on usage or cost data, so every cost figure on Olakai’s OpenAI page is tracked per API key, not per developer, until someone manually maps a key to a person through Developer Identities. Olakai surfaces that as an inline notice on the OpenAI page too, the same way it surfaces the Vertex cost lag.
Line those three up and you get three genuinely different honesty postures across five supported providers: Anthropic and Cursor (real-time, no gap), OpenAI (real-time, but per-key rather than per-person until mapped), and Google Vertex (accurate, but lagged 24-48 hours, reconciled to an actual invoice rather than estimated). Most cost dashboards flatten this into one undifferentiated “estimated cost” figure across every vendor. Treating five providers as five different measurement problems, and disclosing the difference in the product itself, is a small thing that adds up to a much more defensible number when it lands in front of finance.
Unattributed spend, by design
Per-developer cost allocation for Vertex works by taking each developer’s share of tokens consumed and reconciling that share against the actual billed total once it lands — an allocated figure, not a metered one, and Olakai is specific about which of the two it is. There’s a real limitation baked into that method worth stating plainly: per-developer Vertex cost specifically covers Gemini CLI usage. Antigravity and other Vertex activity that Olakai can’t track at the token level carries no token count to allocate by, so that spend lands in a distinct “Unattributed” row instead of getting force-divided across developers who may not have generated it.
That’s the same instinct as the cost-lag notice, applied to a different problem: when the system doesn’t have a reliable basis for attributing a dollar to a specific person, it says “Unattributed” instead of guessing. For a finance team trying to reconcile AI coding spend against headcount and productivity, an honest “we don’t know whose this is” line is more useful than a falsely precise number that quietly absorbs error into every developer’s total.
Why this matters more than it sounds like it should
None of this is exotic engineering — it’s disclosure. But disclosure is exactly what’s missing from most AI cost tools, and it’s exactly what a CFO needs before treating a number as board-ready. “This $4,200 is Google’s actual invoice, reconciled through BigQuery” and “this other number is a real-time token estimate that hasn’t been billed yet” are two different claims, and conflating them into one undifferentiated “AI spend” figure is how companies end up surprised by their own AI bill months after the fact — the same surprise Olakai’s budget alerts are built to prevent going forward.
The broader point of building this level of provider-specific honesty into the product is the same one that runs through the rest of the AI Impact Dashboard: a vendor-neutral platform that treats every provider’s data the way that provider’s data actually behaves, rather than smoothing five different billing realities into one uniform-looking chart. It’s a less impressive-sounding pitch than “real-time cost visibility across every AI vendor.” It’s also the one that survives an audit.
Want to see exactly which of your AI coding costs are real invoices and which are estimates waiting to reconcile? Talk to an Expert.
The first objection a CISO raises to almost any AI analytics pitch is some version of the same question: “so now I need to put another agent on every developer’s laptop?” It’s a fair question — security teams have spent years fighting endpoint sprawl, and a new mandatory install is a real cost even when the tool behind it is useful. For Olakai’s AI coding tool detection, the answer is no. Nothing runs on a developer’s machine. The entire signal comes from pull request data that already exists in GitHub, Bitbucket, or GitLab, read through the same organization-level credential used to power the AI Impact Dashboard.
That’s a meaningfully different trust posture than most AI monitoring tools, and it’s worth walking through exactly how the detection actually works — not as a black box, but as a stack of specific, checkable signals, with an honest fallback for the cases none of them catch.
Three signals, applied in order
Every merged pull request is checked against three detection methods. First, bot author detection: was the PR opened by a known bot account — dependabot, renovate, devin-ai, copilot-swe-agent, claude-code, sweep-ai, snyk-bot, and others recognized by GitHub’s own `user.type === “Bot”` flag? Second, commit co-author trailers: do any commits in the PR carry a Co-authored-by: line matching a known AI tool pattern, covering GitHub Copilot, Cursor, Claude Code, Devin, Amazon Q, and Gemini? Third, PR title and body markers: does the PR’s own text contain a recognizable phrase — “Generated by Cursor,” “claude-code,” “Copilot Workspace,” “Created by Devin,” and similar strings that AI tools leave behind by convention?
If any one of those three signals fires, the PR is classified AI-assisted — and a single PR can be attributed to more than one tool if different commits carry different signals, which happens more than you’d expect on PRs where a human picks up and finishes AI-started work. A PR earns the stronger label of fully agentic specifically when a bot account opened it: the AI created the branch, wrote the code, and opened the PR itself, without a human author in the loop at all. That’s a real distinction, not a marketing one — a fully agentic PR is a different governance conversation than one where a human developer used AI as a fast collaborator.
What happens when none of the three signals fire
Not every AI-assisted PR leaves a clean marker. A developer might paste AI-generated code into a normal commit with no trailer, no bot account, and no mention in the PR body. For that gray area, Olakai runs an LLM classifier — Claude Haiku 4.5 — that reads the PR title, body, and a sample of the diff, and assigns a confidence score. Critically, the PR is only marked AI-assisted through this path at 60% confidence or higher; anything below that threshold is treated as “not detected,” specifically so ambiguous cases don’t get counted and inflate the AI-assisted total.
That’s a deliberate design decision worth sitting with for a second: the system is built to under-count in ambiguous cases rather than over-claim. Most vendors pitching AI-coding-tool ROI have every incentive to inflate the “AI is helping” number — a bigger adoption percentage is a better story. Olakai’s classifier does the opposite by default, which is exactly the kind of choice that should show up in an honest AI coding tool ROI metric instead of a vanity one.
Multi-provider integrity, and where the fidelity differs
Three source-control providers feed the same underlying pull-request table: GitHub, the production integration with the most mature detection signal set; Bitbucket Cloud, currently in beta; and GitLab, covering both SaaS and self-managed instances, using the same signal types plus GitLab-specific Duo markers. Every row is uniquely keyed by account, provider, repository, and PR number, so an organization running both GitHub and Bitbucket at once never gets a collided or double-counted PR — the two providers’ data sits cleanly side by side in the same analytics.
Fidelity isn’t identical across providers, and Olakai says so rather than presenting every provider as equivalent. Bitbucket and GitLab have no first-class “review” object the way GitHub does, so review rounds and approvals are derived from each platform’s activity stream instead of native review submissions — directionally correct, but lower-fidelity than GitHub’s numbers. Any cross-provider cycle-time comparison should carry that caveat rather than treating a GitHub PR and a Bitbucket PR as measured on perfectly identical instruments.
Whose PR is this, exactly?
Detecting AI usage is only half the problem; attributing it to the right developer is the other half, and it’s less glamorous but just as important. Olakai resolves author identity through a four-step priority order: first, the commit email from a commit whose author matches the PR opener, excluding GitHub’s own noreply addresses; if that’s unavailable, the email from the PR’s first commit; failing that, the email on the GitHub user profile; and as a last resort, a constructed noreply fallback built from the GitHub login. That chain exists because real organizations have messy Git configuration — different emails on different machines, corporate SSO aliases, personal accounts used for a first commit — and per-developer ROI attribution is worthless if it silently drops or misattributes a chunk of activity because someone’s `git config` didn’t match their Olakai account exactly.
The same pull-request pipeline also captures signals beyond raw detection — PR size classification from XS to XL by lines added (used to flag AI PRs that are suspiciously always large, which the documentation itself calls a potential sign of rubber-stamping), issue linkage via Fixes #N or Closes #N references, first-pass approval rate, and a test-file ratio that the product is explicit about not being perfect: it’s based on file count, not line count, so a PR with one large test file and many small source files reads as low-coverage even when it isn’t. Publishing that limitation alongside the metric is the same pattern as the LLM classifier’s 60% confidence floor — under-claim rather than over-claim.
Put together, the detection layer is the foundation everything else in Olakai’s AI monitoring is built on — the PR mix, the cycle-time comparisons, the productivity score, all of it depends on getting “was this PR actually AI-assisted, and by which tool” right at the source, without asking a single developer to install anything. For a CISO evaluating the tool, that’s the actual pitch: the analytics run on data your organization already generates and already controls access to, not on a new agent asking for a new set of permissions.
Want to see what this detection stack finds in your own repositories before rolling it out further? Talk to an Expert.
For 25 years, the entire direction of travel in enterprise software was the same: everything moved to the browser. Salesforce on CDs gave way to Salesforce in a tab, Office gave way to Google Docs, Sketch gave way to Figma, and every installer eventually got replaced by a URL. The logic behind that shift was airtight. Zero friction to distribute, one codebase across every operating system, native multiplayer, continuous deployment, and a subscription revenue model that buyers actually preferred. The web won so decisively that even Adobe capitulated to subscription pricing in 2013, and Microsoft declared itself “cloud-first” within 52 days of Satya Nadella taking over in 2014. If you were building software in 2020 and told a VC you were shipping a desktop app, you were laughed out of the room.
And then, somewhere in the last 18 months, every AI-native company that could have stayed browser-only started shipping desktop apps instead.
OpenAI released a ChatGPT Mac app in May 2024, before they had reached feature parity on mobile. Anthropic followed with Claude desktop in November, alongside the Model Context Protocol, which went from around 2 million to 97 million monthly SDK downloads in 16 months. The entire point of MCP is giving AI access to the local filesystem that browsers cannot reach. Perplexity shipped a native Mac app. Cursor, a desktop IDE you download and install the old-fashioned way, is reportedly in talks to raise at a $50 billion valuation, which is roughly the last price tag attached to a desktop-first software company when that company was Microsoft.
Meanwhile Ollama, which exists purely to run AI models locally on your laptop with no API call involved, went from around 100,000 monthly downloads in early 2023 to over 52 million in early 2026. That is a 520x increase in three years for a product whose defining feature is that it does not touch the cloud. And Microsoft, the same Microsoft that was cloud-first, now mandates that every Copilot+ PC ship with 40 trillion operations per second of on-device AI silicon. The company that spent a decade telling its customers to move everything to Azure is now re-engineering consumer PCs around local inference.
The Web Won on Five Things, and AI Wants All Five Reversed
Every piece of enterprise software that moved to the browser did so because the browser offered five structural advantages: zero-friction distribution, SaaS economics, native multiplayer collaboration, cross-device access, and continuous deployment. For most categories, those advantages were decisive. Desktop software only held on in the handful of places where GPU access, filesystem access, offline reliability, or sub-10-millisecond latency were in the critical path. Video editing stayed on the desktop. So did CAD, IDEs, gaming, and anything that needed to push pixels or bits in real time. Those constraints were not ideological. They were physics.
And every serious AI workload happens to sit squarely inside them. AI agents need to read your actual codebase, not whatever you remembered to paste into a chat window. They run for minutes or hours, not the lifetime of a browser tab that the operating system feels free to suspend the moment you switch windows. Meeting copilots need raw screen and audio access that browsers wall off by design, for good security reasons. Voice AI and autocomplete UX fall apart the moment you introduce a network round-trip, which is why Cursor feels instant and most browser-based AI tools feel laggy. The same constraints that kept Premiere on the desktop in 2005 are now shaping the entire AI application layer in 2026, which means for the first time in a generation the list of software categories that have to live on your machine is growing rather than shrinking.
And That Creates a Measurement Problem
Here is where this gets interesting for anyone trying to run an enterprise AI program.
When AI lived in the browser, you could measure it. Your employees logged into ChatGPT through a centralized account, or they used a SaaS tool whose admin console told you exactly who used what and when. Single sign-on, audit logs, API gateway usage reports, the entire governance stack that evolved for SaaS could be pointed at AI with a few configuration tweaks. The web’s centralization was a pain point for vendors in 2000 and a gift to CIOs in 2020. Everything flowed through a known endpoint, and everything left a trace.
The desktop renaissance is dismantling that model, category by category, in a matter of months.
A developer using Cursor is running AI inference against your codebase on their local machine, and your IT team cannot see what they are doing through any centralized log. A knowledge worker using Claude desktop is having conversations with a foundation model that may or may not touch your network. A sales leader using Granola is recording every meeting on their device, with no browser session to inspect. A product team experimenting with Ollama is pulling seventy-billion-parameter models down from Hugging Face and running inference entirely offline, with no API call that your network observability tools can capture. The shadow AI problem that was already keeping CISOs up at night is about to get qualitatively worse, because the new generation of AI tools is specifically engineered to bypass the centralized chokepoints that corporate governance depends on.
You cannot measure what you cannot see, and you cannot govern what you cannot measure. The measurement gap that enterprises are already struggling to close in their AI ROI programs is about to widen significantly, precisely at the moment when boards and CFOs are starting to demand proof of value.
What the Old Playbook Got Wrong
For years, the default AI governance playbook at most enterprises has been some version of: restrict access to sanctioned tools, route traffic through an approved gateway, and generate usage reports from the gateway logs. That playbook works reasonably well when the AI tool in question is a cloud-hosted chatbot that an employee reaches through a browser. It falls apart the moment the AI tool is a desktop app that talks directly to a foundation model provider, or worse, runs inference on the laptop itself.
The uncomfortable truth is that measurement and governance in an AI-first enterprise cannot be built from the network layer or from SaaS admin consoles alone. You need a visibility layer that works across cloud, browser, desktop, and local-inference environments, and that treats each AI interaction as an observable event regardless of where the compute happened. You need metrics that CFOs actually want to see rather than vanity counts of API calls. And you need a governance model that assumes AI usage is heterogeneous and distributed by default, not centralized and inspectable by default.
What Leaders Should Do Now
The shift to AI-native desktop is not a reason to panic, and it is not a reason to try to block desktop AI apps. Every serious study on enterprise AI adoption points to the same conclusion: knowledge workers will use the tools that make them productive, and the companies that lean into that rather than fighting it capture disproportionate value. The question is not whether to allow your teams to use Cursor and Claude and Ollama. The question is whether you can see enough of what is happening across all of them to understand the true ROI of agentic AI, catch governance failures before they become incidents, and make informed decisions about where to invest next.
That starts with accepting that your AI measurement layer needs to extend into the desktop, the IDE, and the on-device inference runtime, not just the browser. It continues with building unified AI analytics that aggregate events from across environments into a single view. And it ends with a governance model that is resilient to heterogeneity, because the direction of travel for the next five years is more AI, in more places, running on more devices, against more models, not less.
The desktop is back. The browser is not going away. Most enterprises will run both, permanently. The organizations that win will be the ones that can see across both, measure across both, and make decisions grounded in that visibility.
If you are thinking about how to build that measurement layer inside your organization, we would love to talk.
Someone at Meta built a leaderboard called Claudeonomics. It ranked employees by the number of tokens their AI models processed and generated. Top spenders got rewards. Then it leaked to the press. Then Meta quietly shut it down.
That was earlier this month. This week, Reid Hoffman came out in measured defense of the practice at Semafor’s World Economy Summit. On the same day, an inference-infrastructure startup called Parasail raised $32 million on the thesis that “tokenmaxxing” will create the next compute giant. The company already generates 500 billion tokens a day.
If you run an AI program and you haven’t yet been asked by your CEO or your board why your engineers aren’t in the top quartile of token consumption, you will be soon. And when that conversation arrives, you need a better answer than a bigger number.
What tokenmaxxing actually measures
A token is a small chunk of text an AI model processes. Every prompt consumed, every response generated, every line of code auto-completed — they all add up to a token count. “Maxxing” is Gen Z slang for optimizing something to the extreme. Put them together and you get the idea: rank employees by how many tokens they burn, and call the top of the list your best AI adopters.
Meta built the internal dashboard. Shopify folded AI usage into performance reviews. Venture capital is now funding the picks and shovels. Hoffman’s defense, notable because he’s one of the more careful voices in the debate, was a cautious endorsement: “You should be getting people at all different kinds of functions actually engaging and experimenting [with AI].” He then immediately added that token tracking “doesn’t mean it’s a perfect example of productivity.”
Read that second sentence again. The strongest public defender of tokenmaxxing concedes, in the same breath, that it doesn’t measure productivity. Which raises the question everyone at Meta was too polite to ask before the leaderboard leaked: what exactly are we measuring, and why?
The new lines of code
If this pattern feels familiar, it should. For decades, engineering organizations tried measuring developer productivity by lines of code written. The metric was easy to count, easy to rank, and spectacularly broken. Engineers who wrote terse, elegant code scored poorly. Engineers who produced verbose, repetitive code scored well. Every competent engineering leader learned the lesson the hard way: when you turn an input metric into a target, people optimize for the metric, not the work.
Economists call this Goodhart’s Law. When a measure becomes a target, it ceases to be a good measure. Token consumption is lines of code with a fresh coat of paint. It’s an input. It’s easy to count. And it tells you almost nothing about whether the work the AI produced was useful, correct, or worth the compute bill that came with it.
The cynical version of tokenmaxxing plays out predictably. Employees pad their AI usage with throwaway prompts. Managers celebrate the chart going up. Finance sees the OpenAI and Anthropic invoices climbing and asks what changed. Nobody can tell them, because the leaderboard only measures spend. We covered this exact anti-pattern in AI Metrics That Matter — the gap between what’s easy to count and what a CFO actually wants to see.
Why it’s seductive anyway
Tokenmaxxing isn’t popular because executives are naive. It’s popular because real AI measurement is hard and token counts are sitting right there in the API billing dashboard. When a CEO asks the head of AI whether the organization is actually using its new tools, “we processed 4.2 billion tokens last quarter, up 340%” is a satisfying answer to give. It’s specific. It’s directional. It trends up and to the right.
It’s also, as NVIDIA’s recent survey of 3,200 enterprise leaders revealed, roughly the level of measurement most organizations have settled for. As we covered in our analysis of the NVIDIA State of AI report, 30% of enterprises still cannot measure the ROI of their AI investments at all. Token counts are what you reach for when you’ve given up on measuring the thing you actually care about.
The other reason tokenmaxxing spreads is that it pushes a real problem — AI adoption — through an easy pipe. In most enterprises, the gap between AI tool licenses purchased and AI tools actually used by employees is enormous. Licenses go unclaimed. Copilots go idle. Shadow AI proliferates in the gap. Counting tokens at least tells you who’s trying something. But “trying something” is a foundation for measurement, not its destination.
What outcome-based measurement looks like
The measurement you want isn’t on the API invoice. It’s in the business system the AI was supposed to change. If your developers are using AI coding tools, the question isn’t how many tokens they generated — it’s whether cycle time dropped, whether pull request quality held, whether production incidents stayed flat. If your sales team is using an AI assistant, the question is whether deal velocity improved, not whether reps sent more prompts.
This is the measurement layer missing from almost every tokenmaxxing dashboard we’ve seen. It’s also the layer that Coding IQ and the rest of the Olakai platform exist to provide. The question we ask our customers to answer isn’t “how much AI did you use?” It’s “what did your AI produce, for whom, and at what business outcome?” Those three questions are the ones a CFO will ask when the bill arrives, and the ones a CISO will ask when governance gets challenged.
We built an entire framework around this. We call it SEE → MEASURE → DECIDE → ACT. SEE surfaces every AI tool in use, not just the sanctioned ones. MEASURE ties usage to business KPIs the executive team already cares about. DECIDE gives you the evidence to scale, fix, or kill each pilot. ACT turns the answers into an operating rhythm instead of a once-a-quarter scramble. None of those steps begin with token counts. All of them produce numbers your board will actually recognize as value.
The governance blind spot
There’s a second problem with tokenmaxxing that rarely gets discussed. A leaderboard that rewards token spend creates an incentive to bypass governance controls to get more of it. Employees who find a sanctioned tool too slow, too throttled, or too narrow in capability will reach for something unsanctioned. Shadow AI already grew fast in the absence of measurement. Adding a scoreboard that rewards consumption accelerates it.
This is the worry that haunts every CISO we talk to, and it’s why the CFO view and the CISO view of AI can’t live in separate dashboards. You cannot measure AI ROI without measuring AI risk, because the risk is the other half of the cost. Tokenmaxxing, by design, only counts one side.
Getting started: audit what your AI produces, not what it consumes
If your organization is under pressure to show AI adoption and you’re being nudged toward tokenmaxxing, there’s a better first step. Pick the three most visible AI deployments in your organization — coding assistants, a customer support copilot, a sales enablement tool — and, for each one, write down the business outcome it was supposed to change. Cycle time. First-contact resolution. Win rate. Whatever it is, write it down. Then measure whether the outcome moved. Our AI ROI framework walks through this end to end.
Do that for three deployments and you’ll know more about the real state of AI in your organization than any token leaderboard will tell you. You’ll also have the beginnings of a measurement system that survives the next wave of AI hype, whatever it gets called. Lines of code didn’t survive the last one. Tokenmaxxing won’t survive this one. Outcomes always do.
Olakai helps enterprises measure what their AI is actually producing — across every tool, every user, every workflow — and tie it back to the business KPIs executives already track. If tokenmaxxing is the conversation your board is having, we can help you lead a better one. Talk to an expert.
Ask most VPs of Engineering how AI coding tools are doing on their team, and you’ll get an adoption number: “80% of developers used Claude Code or Cursor last month.” That number answers a real question, but not the one the CFO is actually asking. Adoption tells you who opened the tool. It says nothing about whether the team is shipping more, shipping faster, or shipping the same amount of code with an extra subscription line item attached.
That gap is wider than most engineering leaders assume. A Black Duck survey of over 800 enterprise software engineers and DevOps professionals, published in June 2026, found AI coding assistant adoption had hit 97% — functionally universal — while the same research pointed to governance and measurement, not adoption, as the actual multiplier on ROI. Everyone has the tool. Not everyone can prove what it’s doing. That’s the exact problem the Olakai Agentic AI Impact Dashboard was built to close, and it’s worth walking through how it actually does that, tab by tab, rather than taking the “proof of AI value” claim on faith.
Overview: what you’re actually spending, and what came back
The Overview tab starts with money, and it’s careful about which money is real. The Spend Summary section adds two genuinely different billing streams together: Admin API costs, which are token-billed usage pulled straight from Anthropic, Cursor, and OpenAI’s Admin APIs — the same figure that lands on the actual invoice for usage-priced plans — and licensing costs, seat subscriptions like Cursor Business or GitHub Copilot seats, prorated to the selected window. Most companies pay both at once: token bills for power users on usage plans, seat licenses for everyone else on subscription plans. Adding them together is the number finance actually writes the check for.
What the dashboard refuses to call the resulting monthly figure is instructive. The “Projected 30 day” number is explicitly labeled a straight-line extrapolation, not a forecast — actual spend times 30 divided by 7, answering “if the next 23 days look like the last 7, what does a full month cost?” It doesn’t model growth, seasonality, or seat changes, and Olakai says so in the product rather than letting a rough projection masquerade as a confident prediction. That distinction matters more than it sounds like it should: a lot of AI analytics tools show a single “forecasted spend” number with no indication of how much confidence to put in it.
The Codebase Outcomes section is where spend turns into a claim about output — AI Code Ratio (the percentage of lines from AI-assisted pull requests, daily) and PR Volume (AI versus non-AI PRs per day), framed explicitly as “the shipped result of the AI coding activity above.” It’s a deliberate causal chain: spend, then activity, then shipped outcome — not three unrelated charts sitting next to each other.
PR Analysis: a three-way split, not a binary one
The PR Analysis tab is the place most “is AI making us ship more?” conversations should start. Instead of a simple AI-versus-human split, every pull request in the window lands in one of three buckets: Fully Agentic (an AI agent drove it end to end — Claude Code, Cursor Agent, and similar), Human + AI Assisted (AI helped, but a person drove the work), and Non-AI. Each bucket shows both a count and its share of all PRs, and the distinction between fully agentic and assisted work is the kind of nuance that a single “AI adoption %” figure erases entirely — a team where AI opens and merges PRs unsupervised is a fundamentally different governance conversation than one where AI is a fast autocomplete for human-driven work.
Underneath the headline split sits a searchable, sortable table with per-PR granularity: repository, author, percentage of AI-attributed code, which specific AI tools touched the PR, lines added and removed, cycle time, and merge date. That level of detail is what turns “our AI adoption looks healthy” into something a VP of Engineering can actually defend in a planning meeting — a specific repo, a specific tool, a specific number, not an aggregate percentage nobody can trace back to real work, and it’s the same granularity that separates a real AI coding tool ROI metric from acceptance-rate vanity numbers.
Cycle Time: the tail matters as much as the average
The Cycle Time tab compares AI-assisted and non-AI pull requests at three percentiles — p50, p75, and p90 — each with a “N% faster” or “N% slower” delta column. That’s a deliberate methodological choice, not an arbitrary one: p50 tells you what a typical PR looks like, while p90 tells you whether AI is helping — or actively hurting — the slow tail of your worst cases. An average alone can hide a tool that makes routine work faster while making the hard, unusual PRs meaningfully worse; percentiles don’t let that hide.
The tab also tracks issue linkage — the average number of tracked issues linked per PR via Fixes #N or Closes #N references — alongside the overall first-pass approval rate, as a check on whether AI-assisted PRs are solving planned, tracked work or generating ad-hoc changes nobody asked for. And it’s explicit about its own limits: breakdowns are available per-repository and per-AI-tool, but there is no per-team view on this tab. If you need a team-level cut, that’s a different report, not a filter you’re missing here.
The number that goes in the board deck
All of this rolls up into two composite figures designed for a leadership audience rather than an engineering one. The AI Productivity Score is a 0-100 composite built from four weighted components — Adoption (25 points), Speed (30 points), Quality (25 points), and Efficiency (20 points) — giving a single number that moves as the underlying PR data moves, with an eight-week trend sparkline. Next to it sits AI Equivalent Engineers: the productivity gain expressed as “how many additional full-time engineers’ worth of output your AI tools are producing,” which converts into a quarterly dollar figure at a configurable fully-loaded engineer cost (the default is $200,000 a year).
The honest part is what happens when the sample is small. Olakai attaches an explicit confidence tier to the Equivalent Engineers figure based on how many developers qualify for the underlying before/after comparison: High confidence needs 15 or more qualifying developers and is described as suitable for executive reporting; Medium is 5 to 14, useful for planning; Low is 3 to 4, a preliminary signal only; and below 3 qualifying developers, the guidance is blunt — do not use this for decisions. That’s an unusual thing for an analytics vendor to put in its own product: a built-in instruction not to trust its own headline metric below a stated threshold. For a platform built on the premise of vendor-neutral, board-ready proof rather than vanity dashboards, that kind of restraint is the point, not an afterthought.
Two things the Impact Dashboard covers in more depth than this post has room for: the Developers tab, which breaks adoption down into cohorts covered in depth in Power, Casual, New, Idle, and the Productivity tab’s before/after methodology, which compares each developer against their own historical baseline rather than against peers. Both are real, separately documented mechanisms worth their own explanation.
None of this requires installing anything new on a developer’s machine — it runs on pull request data Olakai already has access to through your connected GitHub, Bitbucket, or GitLab organization, which is also why it works the same way regardless of which AI coding tools your teams actually use. That vendor-neutral posture is what makes the dashboard useful for a mixed fleet — Claude Code here, Cursor there, Copilot somewhere else — instead of a single-vendor usage report dressed up as an ROI tool, and it’s the same reason generating code isn’t the same as generating value across a mixed toolset.
If your organization already has a mixed toolset and a growing AI coding bill, the harder question isn’t whether to measure impact — it’s whether the number you’re currently reporting up would survive this level of scrutiny. Talk to an Expert to see the AI Impact Dashboard against your own repositories.
A year ago, the knock on AI in finance was simple: it can’t do math. And honestly, the critics had a point. A University of Waterloo study found that GPT-4o got basic multiplication wrong more than 70% of the time. The internet’s favorite example was even simpler than that: ask ChatGPT how many R’s are in “strawberry” and it would confidently tell you two. For CFOs and finance leaders watching from the sidelines, the message was clear. If this thing can’t count letters, it’s not touching our books.
That was twelve months ago. The tools caught up faster than almost anyone predicted. Reasoning models, code execution, structured outputs, and vertical-specific AI applications have closed the gap between “can’t do math” and “cuts your financial close by a week.” And now we have the data to prove it.
Finance Is the Second-Biggest AI ROI Story Nobody’s Talking About
Silicon Valley Bank just published their 2026 State of the VC-Backed CFO report, surveying 230 finance leaders at high-performing venture-backed companies. The headline finding on AI: 51% of companies that budgeted for AI tools last year report measurable ROI from that spending. But the more interesting number is the breakdown by function.
Product and Engineering leads at 73%, which surprises no one. The AI coding assistant market has been the loudest story in enterprise software for two years. But right behind it, at 42%, is Finance. Ahead of Marketing (41%), Customer Support (41%), Sales (34%), and Legal (27%). Finance teams are quietly generating more measurable AI returns than almost every other function in the company, and the conversation hasn’t caught up yet.
Most of the media coverage, the conference panels, and the vendor marketing around AI ROI have centered on engineering productivity. That makes sense — that’s where the tooling matured first. But the SVB data tells a different story. The CFO’s office is becoming one of the most productive proving grounds for AI in the enterprise, and the returns are showing up in places that directly affect the bottom line.
Where AI Is Delivering Real Returns in Finance
So where exactly is the 42% coming from? The gains are concentrated in a handful of core finance operations that share a common trait: they’re repetitive, data-heavy, and historically consumed enormous amounts of skilled human time.
The monthly close. A joint study from MIT Sloan and Stanford GSB, published in August 2025, analyzed hundreds of thousands of transactions across 79 companies and found that AI cuts the monthly financial close by 7.5 days on average. For anyone who’s lived through the close process, that number speaks for itself. A week back is a week of analysis, planning, and decision-making that finance teams didn’t have before.
FP&A and forecasting. Financial planning and analysis teams are running forecast cycles 30-40% faster with AI-assisted modeling. The FP&A function has historically been one of the most strategic roles in finance but also one of the most time-constrained. When your team spends less time building the model and more time interpreting what it says, the quality of the output changes. According to a 2025 FP&A Trends survey, 53% of organizations still don’t use AI in any FP&A process, which means the early movers have a significant head start.
Accounts payable and cost analytics. McKinsey found that 44% of CFOs now use generative AI across five or more finance use cases, up from just 7% the year before. AP processing, cost analytics, variance analysis, and fraud detection are among the most common deployments. These aren’t moonshot applications. They’re the blocking and tackling of corporate finance, automated at scale for the first time.
The SVB report adds another layer to this: companies that reported ROI from AI in customer service applications showed the highest median revenue per employee at $327K, followed by Marketing at $311K and Finance at $259K. Finance may not top that particular metric, but the breadth of its AI adoption across multiple sub-functions — close, FP&A, AP, audit, compliance — makes it one of the most versatile AI verticals inside any company.
The Spending Is Accelerating. The Measurement Isn’t.
The SVB report reveals just how aggressively companies are investing in AI. Median spending on AI platforms and tools jumped from $2K in 2024 to $20K in 2025 — a 10x increase in a single year. CFOs expect that to double again to $50K in 2026. And 65% of the companies surveyed plan to spend more on AI this year than they spent on accounting software last year. That’s a striking data point. AI budgets are approaching parity with one of the most established categories in enterprise finance software.
But here’s the tension: while spending is doubling, only about half of companies can actually demonstrate that the investment is working. The other 49% are spending without a clear picture of return. This is a familiar pattern in enterprise technology adoption. The budget moves faster than the infrastructure to measure what it’s actually producing.
Deloitte’s Q4 2025 CFO Signals survey reinforces this gap. Among 200 North American CFOs at companies with $1B+ in revenue, 87% said AI would be “extremely or very important” to finance operations in 2026. Technology transformation displaced enterprise risk management as CFOs’ top priority for the first time. Yet only 21% of active AI users in finance said it had delivered clear, measurable value. The ambition is there. The measurement infrastructure, for most companies, is not.
This is the core problem we’re building Olakai to solve. Not running the AI, but giving finance leaders — and every other function — visibility into whether their AI investments are actually delivering returns. When you can measure AI ROI across tools, teams, and use cases from a single platform, the conversation with the board changes from “we think AI is working” to “here’s exactly what it’s producing.”
Why This Matters for CFOs and Board Members Right Now
The SVB data carries an implication that goes beyond operational efficiency. Companies that have demonstrated ROI from AI implementation are half as likely to have raised a bridge round or extension round in the last 12 months compared to those that haven’t. AI isn’t just saving time in the back office — it’s becoming a signal of operational discipline that investors are watching for.
Meanwhile, 91% of the VC-backed companies surveyed now encourage employees to use AI at work, up from 68% last year. One in three companies is already hiring fewer junior-level employees because of AI. The workforce implications are real and accelerating, and they’re landing squarely on the CFO’s desk — headcount planning, budget reallocation, productivity benchmarking, all of it.
For CFOs and board members who haven’t yet engaged deeply with AI in their own function, the SVB report should be a catalyst. The question is no longer whether AI can handle finance work. The “strawberry” era is over. The question is whether your organization can measure the value it’s already generating — and whether you can build the framework to prove ROI before your next board meeting.
Getting Started: Three Steps for Finance Leaders
If the SVB data resonates and you’re thinking about where to start, the playbook is more straightforward than it appears. First, audit what your team is already using. Gartner’s 2025 data shows that 59% of finance functions have already adopted some form of AI, but in many cases leadership doesn’t have full visibility into what tools are deployed, who’s using them, and what they’re accomplishing. Start with a visibility audit — you can’t measure what you can’t see.
Second, pick one high-volume process and measure it. The monthly close is the most obvious candidate based on the data, but AP processing and FP&A forecasting are equally strong starting points. Define a baseline, deploy an AI tool, and track the delta. The companies seeing 42% ROI in the SVB survey didn’t transform their entire finance stack overnight. They ran structured pilots, measured the results, and scaled what worked.
Third, build the measurement layer before you scale. The 49% of companies that can’t demonstrate AI ROI aren’t necessarily failing at AI — they’re failing at measurement. Put the infrastructure in place to track what your AI tools are doing across finance before you double the budget. That’s how you turn the SVB report’s 42% from a benchmark into a floor.
The CFO has always been the person in the room who measures everything — revenue, burn, margins, headcount efficiency. Now that same discipline needs to be applied to AI itself. The finance leaders who figure out how to measure their own AI investments are going to be the ones driving the next conversation with their boards.
Talk to an Expert about how Olakai gives finance leaders visibility into AI ROI across every tool and team.
Picture the quarterly board meeting at a Fortune 500 company. The CFO pulls up a slide: $12 million spent on AI tools in the past year. Copilot licenses. Cursor seats. ChatGPT Enterprise. A handful of custom agents. Three pilots that turned into “ongoing experiments.” Then the question: What did we get for it? Silence. Not because the tools aren’t being used — they are, more than anyone expected. Because nobody in the room can answer that question with a number. That’s the gap this post is about.
Enterprise AI measurement today exists at three layers: tool usage and adoption (who’s using what), workflow and productivity impact (are they faster), and business outcomes (did revenue, margin, or retention actually move). The problem is structural. Every measurement tool on the market lives at layer one or two — and calls it ROI. None of them connect to layer three. That’s not a product limitation. It’s a measurement philosophy problem.
1. Microsoft Copilot Analytics
Microsoft’s built-in Copilot Dashboard tracks M365 Copilot usage across the organization: prompts submitted, documents generated, meetings summarized, emails drafted. It’s native to the Microsoft ecosystem, which means zero integration effort and instant visibility for IT admins. For a 10,000-person org paying $30–60 per seat per month, that visibility matters — you’re looking at $3.6 to $7.2 million a year in Copilot licensing alone.
Microsoft Viva Insights Copilot Analytics — tracks usage activity, not business outcomes.
The weakness is fundamental. The dashboard provides a 28-day aggregated view with no per-user ROI correlation and no connection to business outcomes. You know Copilot is being used. You know how often. You have no idea whether it’s helping. Microsoft also disclosed a metric computation bug that underreported email engagement data for nine months — a quiet reminder that vendor-reported metrics aren’t always reliable, even from the vendor itself. Activity is not impact.
2. GitHub Copilot and GitLab Duo Metrics
GitHub Copilot reports code suggestion acceptance rates (averaging 27–30%), time saved per developer (roughly 3.6 hours per week), and suggestion frequency across your engineering org. GitLab Duo offers similar dashboards for its AI features. Developer teams love this data. Engineering leaders use it to justify expansion, track adoption curves, and identify which teams are getting the most value from AI-assisted coding.
GitHub Copilot Metrics — acceptance rates and usage charts, but no connection to business outcomes.
The limitation is scope. These tools measure developers — and only developers using that specific tool. Your marketing team running campaigns through ChatGPT? Invisible. Your finance team using Gemini for forecasting models? Invisible. Your legal team reviewing contracts with Claude? Invisible. And “acceptance rate” is a product metric, not a business metric. A 30% acceptance rate tells you developers kept 30% of suggestions. It says nothing about whether those suggestions shipped faster, reduced bugs, or moved a revenue number. Dev-only measurement in an enterprise where every department uses AI is a partial answer at best.
3. GetDX, Pluralsight Flow, and LinearB
These platforms measure developer productivity through DORA metrics, developer experience scores, PR cycle time, and deployment frequency. They’re legitimate engineering intelligence tools — McKinsey’s 2025 State of AI report found that 88% of organizations have adopted AI, but only 39% can report any EBIT impact. These developer platforms didn’t cause that gap, but they don’t close it either.
DX platform architecture — strong developer intelligence, but scoped to engineering teams. Image courtesy of DX.
The positioning is explicit: these are developer productivity tools, not AI ROI platforms. Some vendors have started rebranding DORA metrics as “AI measurement,” adding overlays that compare AI-assisted versus non-AI-assisted PRs. That’s useful context for an engineering VP. It’s not what the CFO means when she asks about AI ROI. DORA metrics existed before AI coding tools did. Relabeling them doesn’t make them an AI measurement strategy.
4. Workday and ServiceNow Built-In AI Analytics
Both Workday and ServiceNow — along with Salesforce Einstein, SAP Joule, and dozens of other enterprise platforms — now report on their own AI feature usage. Workday shows you AI-generated job descriptions and skills recommendations. ServiceNow tracks virtual agent deflection rates and case summarization usage. The strength is obvious: zero integration effort, immediate availability, and perfect accuracy within that vendor’s walls.
ServiceNow AI Control Tower — comprehensive within ServiceNow, but silent on every other AI tool in the stack. Image courtesy of ServiceNow.
The weakness is equally obvious: each platform is a silo. Workday tells you about Workday AI. ServiceNow tells you about ServiceNow AI. Salesforce tells you about Salesforce AI. Nobody tells you about all of them together. For an enterprise running AI across fifteen platforms, you’d need to log into fifteen dashboards, normalize fifteen different metric definitions, and somehow reconcile them into a single view. Most don’t try. The result is that enterprise AI measurement defaults to whoever shouts the loudest in the vendor review.
5. Custom BI Dashboards (Tableau, Power BI)
This one isn’t a product — it’s a pattern. Many enterprises, frustrated by the limitations above, decide to build their own AI measurement dashboard. Pull API data from each AI tool into a data warehouse, model it in dbt or Databricks, visualize it in Tableau or Power BI. The appeal is total customization: you define the metrics, you own the schema, you control the narrative.
The reality is expensive and slow. Enterprise-grade BI implementations take three to six months for multi-source deployments, and first-year costs for a 5,000-person org run between $510K and $1.2 million — often more than the AI tools being measured. There’s no standardized schema for AI usage data, no external benchmarks to compare against, and every API change from every vendor breaks something. Most custom dashboards become the responsibility of one or two analysts, and when they leave, the dashboard dies with them. You’ve built a measurement tool that costs more than what it measures.
The Real Problem: A Measurement Philosophy Gap
Each of the tools above measures AI in isolation. Microsoft measures Microsoft. GitHub measures GitHub. Workday measures Workday. The custom dashboard tries to stitch them together but creates a maintenance burden that’s unsustainable at enterprise scale. Meanwhile, the actual ROI question is cross-enterprise: which teams adopted which tools, what changed in their output, and did any of it move a business metric?
That question requires connecting three dots: adoption data (who’s using what), productivity signals (what changed in their work), and business outcomes (did it matter). Forrester’s 2026 Predictions report found that fewer than one in three AI decision-makers can tie AI value to P&L changes. Not because they aren’t trying — because their tools don’t connect those layers. That’s not a product gap. It’s a measurement philosophy gap. You can’t vibe-code accountability.
What Olakai Does Differently
This is the problem we built Olakai to solve. Not another vendor-specific dashboard. Not another developer productivity overlay. A vendor-neutral analytics and governance platform that works across your entire AI stack — ChatGPT, Copilot, Gemini, Cursor, Claude, custom agents, and the AI features embedded in your SaaS applications — and connects what’s being used to what it’s actually producing.
Olakai is structured around three product lines, each covering a category that the tools above treat in isolation. Assistive IQ measures adoption, productivity, and shadow AI across chatbots and copilots — deployed through a Chrome extension that takes minutes, not months. Coding IQ connects to your GitHub org and AI coding tool providers to unify cycle time data, AI-assisted PR rates, developer adoption cohorts, and cost-per-PR across Copilot, Cursor, Claude Code, and Windsurf in a single view. Agent IQ tracks custom agentic workflows with execution metrics, success rates, and cost-per-execution tied to business KPIs you define. None of these exist in separate tools. They exist in one platform, measured against the same outcomes.
Olakai — unified AI analytics across assistive, coding, and agentic AI in a single platform.
The difference isn’t just breadth — it’s the connection between layers. Every tool in this article measures activity. Olakai connects that activity to business outcomes through custom KPIs that map AI usage to the metrics your CFO actually reports on: revenue influenced, cost avoided, time recaptured, risk reduced. When the board asks what $12 million in AI spend produced, Olakai is the platform that gives you the answer — not a usage chart, not an acceptance rate, but a number tied to a business result.
We’re not replacing the tools above — most of our customers use several of them. Microsoft Copilot Analytics still tells you how Copilot is being used. GitHub Copilot Metrics still shows acceptance rates. ServiceNow’s AI Control Tower still tracks its own AI features. What none of them do is answer the cross-enterprise question: across all of these tools, all of these teams, all of these investments — are we getting ROI, and where? That’s the layer Olakai provides. And with Kai, anyone on the team can ask that question in plain language and get a reasoned, data-backed answer in seconds — no analyst required, no dashboard to build.
Kai — ask “What’s my AI ROI this month?” and get a reasoned, data-backed answer in seconds.
Most engineering leaders made the same bet in 2024. They licensed GitHub Copilot for the team, added Cursor for the power users, maybe rolled out Claude Code for a few senior engineers. The invoices added up fast. A mid-sized engineering organization with 100 developers can easily spend $400,000 to $600,000 per year across these tools before accounting for the API costs that accumulate quietly in the background.
The bet seemed obvious. The tools were impressive in demos. Every vendor had benchmarks showing dramatic productivity gains. And the competitive pressure to “enable developers with AI” made saying no feel reckless. So the tools went in, the credit cards got charged, and the organization moved on to the next priority.
Twelve months later, most of those organizations still cannot answer the most basic question their CFO will eventually ask: is this working?
The Benchmark Problem
The AI coding tool vendors are not shy about publishing productivity statistics. GitHub claims Copilot users are 55% faster at coding tasks. Cursor publishes testimonials from engineers who describe 10x output improvements. Anthropic’s data on Claude Code shows meaningful reductions in time-to-completion for well-defined tasks.
These numbers are real, in the sense that they come from controlled evaluations of specific tasks. But controlled evaluations are not engineering organizations. The gap between “this tool helped a developer complete an isolated coding challenge faster” and “this tool made our entire engineering organization more effective” is where most ROI analysis breaks down.
The industry research is more sobering. Jellyfish, which analyzes data from over 500 engineering organizations, puts the average cycle time improvement from AI coding tools at around 25%, with PR throughput gains of roughly 12%. Those are meaningful numbers for a well-run rollout. But Jellyfish also tracks adoption rates, and the data shows that AI-assisted PRs account for roughly half of all merged pull requests across their customer base, up from 14% just two years ago — which means roughly half of your developers’ output still has no AI involvement at all, despite the licenses sitting idle in the admin console.
McKinsey’s research on AI-enabled software engineering found that productivity gains are highly uneven across teams and functions, and that organizations with structured measurement programs capture three to four times more value from AI tools than those without. The tools don’t create value uniformly. Whether your organization captures that value depends almost entirely on whether anyone is paying attention to the data.
What “Paying Off” Actually Means
There is a version of this analysis that stops at cycle time. If your AI-assisted pull requests close 25% faster than non-AI PRs, and you can assign a dollar value to engineering time, you can construct a spreadsheet that shows a positive return. Many organizations do exactly this and call it done.
That math is not wrong, but it is incomplete in ways that matter. Three dimensions of ROI tend to get ignored.
Adoption is not uniform. Aggregate adoption rates hide the distribution underneath. In most engineering organizations, AI coding tool adoption follows a familiar pattern: a small cohort of power users who have integrated AI deeply into their workflow, a larger group of casual users who pull the tool out occasionally, a segment who have never meaningfully engaged, and new adopters still learning. These cohorts have entirely different productivity profiles. A 50% adoption rate that is all casual usage delivers a fraction of the value compared to a 50% rate built on genuine depth. The aggregate metric obscures everything interesting.
Tool spending is not consolidated. The average engineering organization is paying for multiple AI coding tools simultaneously. The same developers who have GitHub Copilot licensed are also using Cursor, and some have Claude Code running in their IDE. The vendor consoles report usage for their own tool only. No single view shows you cost per PR across all providers, which tool is delivering the best return per dollar, or where licenses are sitting unused. Without that cross-vendor view, optimization is impossible.
Not all PRs are equal. AI coding tools deliver more value on some work than others. Boilerplate generation, documentation, test writing, and well-scoped feature additions tend to see strong AI contribution. Architecture decisions, complex debugging, and novel problem-solving tend to see less. If your metric is simply “AI code ratio” — the percentage of merged lines that originated from an AI tool — you may be measuring the wrong thing, or at least measuring it in a way that tells you nothing about whether the AI contribution was on the work that matters most.
What Measurement Actually Requires
Getting a real answer to the ROI question requires connecting three data sources that almost no organization has unified.
The first is GitHub data: PR volume, cycle time, AI commit detection, code contribution patterns by developer and team. This is where the before-and-after comparison lives. AI-assisted PRs versus non-AI PRs, by team, by developer cohort, by time period. Without this, you are estimating.
The second is provider cost data: per-user spend, token consumption, acceptance rates, and usage patterns by tool. This requires pulling from the admin APIs of each vendor — Anthropic, GitHub, Cursor, Windsurf, OpenAI — and normalizing the data into a single cost view. The math is not complicated, but the data integration work is non-trivial, and almost no engineering organization has done it.
The third is the developer adoption dimension: who is in which cohort, which teams are getting deep value versus surface-level usage, and where the gaps are. This is where the improvement roadmap lives. If your power user cohort is 8% of your developers and your casual cohort is 42%, you have a very different problem than if those numbers are reversed.
When these three data sources are unified, the analysis becomes tractable. Cost per PR by provider. Cycle time delta for AI-assisted versus non-AI work. Developer cohort distribution by team. Which providers are getting the most usage per dollar. Where idle licenses should be reassigned. These are the questions the CFO is eventually going to ask. The organizations that can answer them will have a very different conversation than those who cannot.
How Coding IQ Approaches This
This is the problem Olakai’s Coding IQ was built to solve. Rather than requiring engineering teams to build custom data pipelines or rely on fragmented vendor consoles, Coding IQ connects directly to your GitHub organization and your AI coding tool admin APIs — Anthropic, GitHub Copilot, Cursor, Windsurf, OpenAI — and pulls the data together automatically.
The result is a unified view: cycle time comparison between AI-assisted and non-AI PRs, provider cost breakdown, developer adoption cohorts (Power, Casual, New, Idle), team-level benchmarks, and a cost-per-PR metric by provider. Questions that previously required a data engineering project — “which coding tool gives us the best ROI?”, “which teams have the lowest AI adoption?”, “what is our AI code ratio trending toward?” — become answerable in seconds.
Coding IQ also surfaces what the vendor dashboards cannot. Shadow AI in engineering is real: developers using personal API keys, unauthorized tools, or AI assistants outside sanctioned tools. A developer who builds on Claude’s API with a personal account doesn’t show up in your GitHub Copilot analytics. Coding IQ detects AI contribution patterns from the code itself — not just from vendor data — so the picture is complete rather than bounded by what each vendor chooses to report.
For organizations already using a dedicated engineering intelligence platform, the question worth asking is whether that platform can show you governance, shadow AI exposure, and the full cross-vendor cost picture alongside your engineering metrics. For most, the answer is no. Coding IQ was built to provide that layer.
The Question Worth Asking Now
Engineering organizations are entering a moment where AI coding tool budgets are large enough to require accountability. The days of “it feels productive” as sufficient justification are ending. CFOs are starting to ask for the data. Boards are asking whether AI investments across the organization are generating returns.
The organizations that will be able to answer those questions are the ones that started measuring before the question was forced on them. Not because the tools are failing — many of them are genuinely delivering value — but because value without measurement is invisible. And invisible value does not survive budget season.
If you are spending $400,000 per year on AI coding tools and cannot answer what your cost per PR is, which teams are in which adoption cohort, or whether your investment would be better concentrated in one tool over another, the issue is not the tools. The issue is measurement.
You have the data. You are probably just not looking at it yet.
Talk to an expert to see how Coding IQ gives engineering leaders the full picture on AI coding tool ROI.
Your engineering team just shipped 10,000 lines of code this sprint. Nearly half of it was written by AI. Do you know which half — and whether it was any good?
This isn’t a theoretical question anymore. According to the 2025 DORA Report, almost half of companies now have at least 50% AI-generated code, up from just 20% at the start of 2025. Ninety percent of engineering teams now use AI coding tools in their workflows. Cursor crossed $2 billion in annualized revenue by February 2026. Claude Code hit $2.5 billion. GitHub Copilot remains embedded in enterprises worldwide. The adoption question is settled.
The measurement question is not.
The Measurement Gap Nobody Talks About
Here’s what most engineering leaders are tracking: lines of code generated, completion acceptance rates, developer satisfaction surveys, and seat utilization. These are vanity metrics. They tell you that developers are using the tools. They don’t tell you whether the tools are making your organization better.
BCG found that 60% of companies have no defined financial KPIs for their AI initiatives — they’re counting pilots, celebrating deployments, and measuring model accuracy instead of actual business value. Bain’s 2025 Technology Report went further, finding that AI coding tools deliver only 10 to 15 percent productivity gains despite adoption by two-thirds of software firms. That’s a fraction of the 10x improvement vendors promised.
The gap between what companies measure and what actually matters is where millions disappear. Your board isn’t asking how many code completions your team accepted last quarter. They’re asking whether your $1.2 million in AI coding tool licenses is making your engineering organization faster, safer, and more competitive. If you can’t answer that question with data, you have a measurement problem — not a productivity problem.
What You Should Be Measuring Instead
The metrics that matter for AI coding tools aren’t about the tools themselves. They’re about what happens after the code ships.
Cycle time delta. How much faster do AI-assisted pull requests move from first commit to production compared to non-AI pull requests? This is the clearest signal of real productivity gain. Early data suggests AI-assisted PRs are 25 to 40 percent faster through the pipeline, but this varies wildly by team, codebase complexity, and tool. If you aren’t measuring the delta, you’re guessing.
Incident rate on AI-authored code. A Stanford study cited by CIO.com found that participants using coding assistants wrote less secure code in 80% of tasks — yet were 3.5 times more likely to believe their code was secure. That confidence gap is dangerous. If your AI-generated code is creating more production incidents, more security vulnerabilities, or more hotfixes, the productivity gains are illusory. You need to track post-deployment quality by code origin.
Cost per pull request by provider. Your team is probably using three or four AI coding tools simultaneously — Copilot on some repos, Cursor on others, Claude Code for complex refactors. Each has different pricing, different token consumption patterns, and different value profiles. Without a unified cost-per-PR metric across providers, you can’t make rational decisions about which tools to standardize and which licenses are going unused.
Deployment frequency. The DORA framework remains the gold standard for engineering performance, but AI introduces a wrinkle. Deployment frequency may rise slightly while lead times increase as review cycles grow longer to accommodate AI-generated code. Measuring deployment frequency in isolation misses this dynamic. You need to track it alongside review time and change failure rate to see the full picture.
The Shadow Coding Problem
There’s another dimension most CTOs haven’t confronted: developers using personal accounts for AI coding tools that your organization doesn’t manage, monitor, or govern.
A developer signs up for Cursor with a personal email. Another uses Claude Code through a personal API key. A third is running a locally hosted model for code generation. None of these show up in your IT asset inventory. None are covered by your data handling policies. And all of them are processing your proprietary source code through systems you don’t control.
This is shadow AI in the codebase — and it’s arguably more dangerous than shadow AI in other parts of the organization because the outputs become permanent parts of your software. Code generated through ungoverned tools gets committed, reviewed, merged, and deployed. It becomes your product. If that code was generated using a model that trained on GPL-licensed code, or if proprietary algorithms were sent to a third-party API without appropriate data handling agreements, the liability sits with your organization — not the developer.
According to HiddenLayer’s 2026 AI Threat Landscape Report, 76% of organizations now cite shadow AI as a definite or probable problem, a 15-point jump from the prior year. For engineering organizations, the stakes are uniquely high because the shadow doesn’t just create risk — it becomes part of the product.
The Adoption Cohort Blindspot
Aggregate metrics hide critical patterns. When engineering leaders report that “our team has 70% AI adoption,” they’re averaging over a distribution that looks nothing like a uniform curve.
In practice, adoption breaks into cohorts. Power users — developers with more than 70% of their pull requests AI-assisted — are producing dramatically different work than casual users at 20 to 40 percent. New adopters who started using AI tools within the past two weeks have different needs than idle users who tried a tool once and stopped. Each cohort requires different support, different training, and different expectations.
Without cohort-level visibility, you can’t identify which developers are getting genuine value, which ones need enablement, and which expensive licenses are sitting unused. You also can’t detect the productivity paradox that multiple studies have now documented: developers predict a 24% speedup from AI tools but some studies have measured a 19% slowdown, while those same developers still report a 20% perceived improvement afterward. The gap between perception and measurement is real, and only cohort-level data can surface it.
What the Competitors Miss
Engineering analytics platforms like Jellyfish have built impressive capabilities for measuring developer productivity. They can track DORA metrics, analyze PR throughput, and benchmark teams against each other. But they were built before AI coding became the default mode of software development, and their architecture reflects that.
Most engineering analytics tools work from metadata — commit timestamps, PR merge events, Jira ticket transitions. They can tell you that a developer merged 12 PRs this week. They can’t tell you which of those PRs were AI-assisted, what tool was used, how much it cost, or whether the AI-generated portions introduced quality issues. Without code-level detection that identifies AI co-author trailers, bot PR authors, and tool-specific markers, the attribution problem remains unsolvable.
Then there’s the governance dimension. Your CISO needs to know which AI tools are processing your source code and whether they comply with your data handling policies. Your CFO needs to know the total cost across all AI coding providers, not just the ones IT provisioned. Your compliance team needs an audit trail showing what code was AI-generated and by which model. Productivity analytics tools don’t cover any of this.
The measurement gap isn’t just about better dashboards. It’s about connecting AI ROI measurement with governance, cost control, and security in a single view — the same way organizations learned to manage cloud infrastructure by combining performance monitoring with cost optimization and compliance controls.
Building the Framework
If you’re spending six or seven figures on AI coding tools and can’t answer basic questions about their impact, here’s where to start.
First, establish a baseline. Before you can measure improvement, you need to know where you stand. What percentage of your pull requests are AI-assisted? What’s your current cycle time for AI-assisted versus non-AI code? What are you spending per developer, per provider, per month? Most engineering organizations can’t answer these questions today.
Second, segment by cohort. Stop reporting a single adoption number. Break your engineering organization into power users, casual users, new adopters, and idle license holders. Each cohort tells a different story, and each requires a different response.
Third, connect quality to origin. Track incident rates, security findings, and change failure rates by whether the code was AI-assisted or not. This is the data your board actually needs — not how many lines the AI generated, but whether those lines made your product better or worse.
Fourth, unify cost visibility. Aggregate spending across Copilot, Cursor, Claude Code, and every other tool your developers are using — including the ones they’re paying for themselves. The enterprise AI revenue gap starts with cost sprawl that nobody can see.
The organizations that will win the AI coding race aren’t the ones that adopt the most tools. They’re the ones that measure the right things, govern the risks, and make data-driven decisions about where to invest. Your AI coding tools are generating code. The question is whether they’re generating value.
Want to see how your engineering AI investment is actually performing? Talk to an expert to see Coding IQ in action — vendor-neutral analytics across every AI coding tool your team uses.
A VP of Operations at a $4 billion manufacturer had the data. Three AI pilots had cleared the DECIDE gate with strong cost-to-value ratios. The CFO had approved scaling budgets. The board was expecting results by Q3. Six months later, all three initiatives were still running at pilot scale. One team couldn’t get IT to provision enterprise licenses. Another was waiting for “the right moment” to roll out to the full department. The third had scaled technically but hadn’t changed a single workflow — so the AI was running at production capacity with pilot-level impact.
Everyone was acting on AI. Nobody was acting systematically. And the gap between “approved for scaling” and “delivering enterprise-wide value” was growing wider every quarter.
This is the ACT problem — the fourth and final step in the SEE, MEASURE, DECIDE, ACT framework. You’ve mapped your AI ecosystem (SEE). You’ve connected activity to business outcomes (MEASURE). You’ve run structured pilots that produce scaling decisions (DECIDE). Now comes the hardest part: turning those decisions into enterprise-wide results that show up on the P&L.
The data says most organizations fail here. PwC’s 2025 Global CEO Survey found that nearly half of CEOs see no meaningful return from their generative AI investments. Not low returns — none. Meanwhile, Gartner projects worldwide AI spending will reach $644 billion in 2025 and continue accelerating. The money is flowing. The returns aren’t. And the difference between the enterprises that scale AI successfully and those that don’t isn’t better technology — it’s better execution frameworks for going from “this pilot works” to “this is how we operate.”
Why Scaling Is Harder Than Piloting
The pilot-to-production gap is where most AI investments die. S&P Global found that enterprises scrapped 46% of AI pilots before reaching production in 2025, and Bain reported that only 27% of companies successfully moved generative AI from testing to real-world implementation. But even among those that do scale, a separate challenge emerges: scaling the technology without scaling the impact.
This happens because organizations treat scaling as a deployment problem — more licenses, more compute, more users. But deployment without transformation just gives you a bigger pilot. The AI is running at scale. The workflows haven’t changed. The organizational structures haven’t adapted. And the business outcomes remain stubbornly similar to what you saw with 50 users, even though you now have 5,000.
Deloitte’s 2026 State of AI survey captured this precisely: while 74% of organizations want AI to drive revenue growth, only about one in five have redesigned workflows around AI capabilities. McKinsey’s data reinforces the point — AI high performers are 2.8 times more likely to redesign workflows than other organizations. Dropping an AI tool into an existing process and hoping for different outcomes isn’t a scaling strategy. It’s wishful thinking at enterprise cost.
The ACT step addresses this with three frameworks that take organizations from “approved pilot” to “operating at scale”: the CFO Conversation, the Cloning Playbook, and the Operating Rhythm.
Framework 1: The CFO Conversation
Every scaling decision eventually becomes a budget conversation. And budget conversations require a language that most AI teams don’t speak fluently: operational economics.
The CFO doesn’t want to hear that the AI agent “saves time.” She wants to know four things, in this order:
What’s the operational cost structure? Total cost of ownership at scale: licensing, compute, integration, support, training, and the ongoing cost of maintaining the system. Not the pilot cost extrapolated — the actual production cost model, including volume discounts, infrastructure scaling curves, and the hidden costs that only appear at scale (data quality maintenance, model drift monitoring, edge case handling).
What’s the counterfactual? What would the organization spend doing this work without AI? This isn’t a theoretical exercise. It’s a concrete comparison: headcount cost, error rates, cycle time, and customer impact in the current state versus the AI-augmented state. The counterfactual is what makes AI ROI defensible. Without it, every efficiency claim is an assertion. With it, it’s arithmetic.
What’s the scaling math? If the pilot showed a 3:1 return with 50 users, what does the model look like with 5,000? Scaling math isn’t linear. Some costs decrease at scale (per-unit licensing), while others increase (integration complexity, change management, support volume). The CFO wants to see the curve, not just the current point. And she wants to see sensitivity analysis — what happens to the return if adoption is 60% instead of 90%, or if the efficiency gain is 25% instead of the 40% the pilot showed.
What are the 90-day gates? Enterprise CFOs don’t write blank checks. They fund in stages, with checkpoints tied to measurable outcomes. A 90-day gate structure might look like: month one, deploy to the first full department and validate that pilot-level performance holds at 10x scale; month two, measure the workflow redesign impact and compare against the counterfactual; month three, present the production economics to the executive committee with a recommendation for the next stage of expansion. Each gate has a defined KPI, a target, and a decision: continue, adjust, or stop.
The enterprises that get CFO buy-in for scaling don’t present dashboards. They present business cases with operational economics, counterfactuals, scaling curves, and stage gates. Building this financial frame before asking for scaling budget is the single most effective way to accelerate AI investment.
Framework 2: The Cloning Playbook
Once the first AI initiative scales successfully, the question becomes: how do you replicate that success across the organization? This is where most enterprises lose momentum. Each new AI project starts from scratch — new vendors, new integrations, new measurement frameworks, new governance reviews. The result is that scaling the second initiative takes almost as long as scaling the first.
The Cloning Playbook treats your first successful AI deployment as a template. It identifies the five elements that made it work — what we call the success DNA — and systematically replicates them in adjacent use cases.
The business case structure. Not just “we saved money” but the specific format: counterfactual baseline, measured outcome, cost-to-value ratio, risk profile. When the first deployment proved value using this structure, don’t reinvent the wheel for deployment two. Use the same template. The CFO already trusts it.
The measurement infrastructure. The hardest part of proving AI ROI is building the instrumentation that connects AI activity to business outcomes. If you built that infrastructure for customer service AI, most of it translates to sales AI or operations AI with minor modifications. The data pipelines, the KPI frameworks, the reporting cadences — these are organizational assets, not project artifacts.
The governance framework. Your governance approach — data classification, security review, compliance validation, risk assessment — was designed and tested during the first deployment. Applying the same framework to deployment two eliminates months of security and legal review. The governance team already knows what “good” looks like.
The change management pattern. How did you train users? How did you redesign workflows? How did you handle resistance? What worked and what didn’t? The human side of AI deployment is where most organizations lose the most time. Cloning the change management playbook that worked — right down to the communication cadence and the training format — compresses rollout timelines dramatically.
The executive sponsorship model. Who championed the first deployment? What organizational authority did they need? How did they maintain momentum through obstacles? The sponsorship structure that works for one AI initiative typically works for others, because the organizational dynamics are the same: competing priorities, resource constraints, and stakeholder skepticism that only yields to demonstrated results.
The math is compelling. Organizations that clone their success DNA from first deployment to second see 70-80% reduction in time-to-value compared to starting from scratch. The first initiative might take nine months to prove ROI. The second takes two to three months, because the infrastructure, governance, measurement, and organizational muscle are already built. By the third and fourth, you’re operating with a repeatable scaling engine.
The key is identifying adjacent workflows — use cases that share enough similarity with your proven deployment that the success DNA transfers cleanly. If your customer service AI succeeded, the adjacent workflows might be internal helpdesk, partner support, or onboarding. If your sales AI proved value, adjacent workflows might be account management, renewals, or lead qualification. Start with the 70-80% that transfers directly and customize only the 20-30% that’s unique to the new context.
Framework 3: The Operating Rhythm
Scaling AI isn’t a project. It’s an operating discipline. The enterprises that sustain AI value over time build measurement and governance into their regular business cadence rather than treating it as a separate workstream.
The Operating Rhythm runs on three cycles:
Monthly: Performance Review. Every AI initiative that has passed the DECIDE gate gets reviewed monthly against its defined business KPIs. Not technical metrics — business outcomes. Revenue influenced, costs avoided, risk events prevented, cycle time reduced. This is the same review cadence your organization already uses for other operational metrics. AI just gets added to the agenda. The monthly review catches performance degradation early, identifies optimization opportunities, and keeps executive attention on AI value rather than AI activity. If an initiative’s KPIs are declining, the monthly review triggers investigation before the quarterly review.
Quarterly: Portfolio Assessment. Every quarter, the AI portfolio gets assessed as a whole. Which initiatives are exceeding their ROI targets? Which are underperforming? Where should the next investment go? This is where the portfolio view that CFOs want becomes actionable. The quarterly assessment looks across all AI investments and asks: given what we now know about performance, risk, and cost, is our portfolio allocation optimal? Should we shift resources from an underperforming initiative to one showing stronger returns? Should we expand a successful deployment to new business units or geographies?
Annual: Strategic Reset. Once a year, step back from operational metrics and assess the AI strategy against the business strategy. Are the use cases you’re scaling still aligned with where the business is heading? Has the competitive landscape changed in ways that require new AI capabilities? Are there emerging technologies — new model architectures, new vendor offerings, new integration patterns — that create opportunities your current portfolio doesn’t capture? The annual reset prevents the common trap of optimizing last year’s AI strategy while the business has moved on to new priorities.
The Operating Rhythm does something that ad hoc AI management cannot: it creates organizational accountability. When AI performance is reviewed monthly alongside other business metrics, it signals that AI is a business function, not an experiment. When portfolio allocation is assessed quarterly, it prevents the resource fragmentation that kills scaling momentum. And when strategy is reset annually, it keeps AI investment aligned with business direction.
The Convergence of Measurement and Governance
Here’s what becomes clear at the ACT stage: measurement and governance aren’t separate disciplines. They’re two faces of the same capability.
The enterprises with the strongest AI ROI data are also the ones with the most rigorous governance frameworks. Not because governance is a compliance exercise, but because governance forces the discipline that measurement requires. Defining what AI is allowed to do means defining what it should be doing. Instrumenting how AI performs for compliance also instruments how it performs for ROI. Maintaining audit trails for regulators also maintains the data trails that prove business value.
This convergence is Olakai’s thesis: that unified visibility across measurement and governance enables enterprises to scale AI with confidence rather than scaling AI and hoping for the best. When you can see every AI system, measure its business impact, govern its risk profile, and control its costs from a single platform, the ACT step becomes dramatically simpler. You’re not stitching together data from five different tools to answer a board question. You’re looking at one dashboard that shows value, risk, and cost together.
The SEE, MEASURE, DECIDE, ACT playbook isn’t just a methodology. It’s an operating system for enterprise AI. And the ACT step is where that operating system proves its worth — not in a pilot, not in a board presentation, but in sustained, measurable business outcomes that compound quarter over quarter.
Start Acting With Data
The 74% of enterprises that want AI revenue growth but can’t prove it share a common failure mode: they act without the infrastructure to know whether their actions are working. They scale without counterfactuals. They expand without cloning success patterns. They operate without cadences that catch problems before they become write-offs.
The 20% who prove AI ROI do something different. They build the CFO conversation before they ask for scaling budget. They clone their success DNA rather than reinventing each deployment. And they embed AI measurement into their monthly, quarterly, and annual operating rhythms so that AI value isn’t a one-time proof point — it’s a continuous, visible, defensible track record.
That’s the ACT framework. And it’s the final step that turns AI from an investment line item into a measurable operating advantage.
Ready to scale your AI investments with confidence?Talk to an expert and we’ll show you how Olakai’s measurement and governance platform turns the SEE, MEASURE, DECIDE, ACT playbook into an operating system for enterprise AI.