
Use case: AI Engineering Productivity
Are AI coding tools making your engineers faster? Measure it on your own repos.
About 90% of developers now use AI at work. In a randomized trial, experienced developers using AI were 19% slower while believing they were 20% faster. Self-reports and vendor acceptance rates will not tell you the truth about your teams. Olakai measures cycle time, review time, AI-assisted pull request share, and cost per PR from your own GitHub and GitLab data, per team and per tool, with nothing to install on a developer’s machine.
Interactive example of the coding record: the eleven things Olakai keeps about an AI coding tool, usage, cost, budgets, tool calls, systems acted on, sub-agents, audit coverage, policy, sensitive data, unattributed keys, and prompt injection. Teal tiles are measured from your own data; blue tiles are controls built into the platform. Illustrative data from the Olakai demonstration environment, not customer data.
Acceptance rate is the wrong metric. So is lines of code.
DORA‘s 2025 report found AI amplifies whatever an engineering organization already is: faster where architectures are loosely coupled and feedback loops are short, no better where they are not. METR‘s 2025 randomized study found the perception gap runs the wrong way. Meanwhile vendors report acceptance rate, which measures suggestion quality, not shipped value, and code analyses show duplicated blocks rising eightfold as AI output grows. The question is not whether AI helps engineering in general. It is whether it helps your teams, on your codebase, with which tools, at what cost.
Olakai answers that from the pull requests themselves: AI-assisted versus not, same team, same period, with cost attached. No agent on the laptop, no survey. Detection is passive, from commit trailers, bot authors, and PR markers through the GitHub and GitLab integrations, and it is a floor: unmarked AI use is not counted, so the number is conservative by design.
90%
of developers now use AI at work, up 14% in a year (DORA 2025, about 5,000 respondents)
19%
slower: experienced developers using AI in METR’s 2025 randomized trial, while believing they were 20% faster
46%
of developers distrust the accuracy of AI output; 3% highly trust it (Stack Overflow Developer Survey 2025)
What you get
What you get with Olakai
Measure
Cycle time delta, per team
Median time from first commit to merge for AI-assisted PRs against non-AI PRs, for the same team in the same period, with review time shown separately so you can see whether AI moved the bottleneck downstream. The same measurement feeds program-level ROI.
Compare
Cost per PR, per tool
Claude Code, Cursor, GitHub Copilot, OpenAI Codex, and Gemini on the same scorecard: spend divided by merged PRs, with seat licenses pro-rated and Copilot handled as seat-based. The number that turns tool sprawl into a standardization decision, with custom KPIs for whatever your teams count.
Coach
Cohorts: who gets value, who needs help
Power, casual, new, and idle developers by AI-assisted PR share. Coach the casual, celebrate the power users, and stop paying for the idle seats. Olakai Agentic ties each cohort to its cost.
Olakai Agentic: what the agents actually did
Shell commands, file edits, and tool calls. Week by week, per turn.
A pull request is the output. What the coding agent did to produce it is the work: the shell commands it ran, the files it edited, the other tools it called, and how many of each it took per turn. Olakai records that activity from the agent hooks, so engineering leaders can see whether an agent is editing code or thrashing, and whether a cheaper model takes more turns to get there. Agent governance applies the same record to autonomous agents outside the IDE.
Interactive example of agent activity. The stacked bars are the shell commands, file edits, and other tool calls recorded from coding agents each week; the toggle switches between weekly totals and actions per turn; the table beneath carries the figures. Illustrative data from the Olakai demonstration environment, not customer data.
Three kinds of action
Shell commands, file edits, and other tool calls, stacked per week, so a change in the mix is visible before it shows up in cycle time.
Totals or per turn
The toggle switches between raw volume and actions per turn, which is the number that separates a busy agent from an effective one.
The weekly table
Every week’s figures beneath the chart, so the trend can be pasted into the engineering review as it is.
Olakai Agentic: coding spend and attribution
What the tokens cost, by provider and model, and how much of it has an owner.
Engineering is where most AI tokens go, and most of them arrive on shared API keys that belong to nobody in particular. Olakai shows daily spend by provider and by model, the project forecast against its budget, and the share of spend that is attributed to a project. The coverage toggle answers the question finance asks first: if the four largest unassigned keys were attributed, how much of the bill would have an owner. This is the engineering half of FinOps for AI, measured on the same data as the cycle-time delta above.
Interactive example of coding spend. The top chart is daily provider spend stacked OpenAI and Anthropic; beside it, spend by model and each project’s forecast against its budget markers; the toggle at the bottom shows what attribution coverage becomes if the four largest unassigned API keys were assigned to projects. Illustrative data from the Olakai demonstration environment, not customer data.
Daily spend, stacked
OpenAI and Anthropic spend by day, with spend by model beside it, so a model switch shows up on the chart the day it happens.
Forecast against budget
Each project’s month-end projection against its budget markers, from the same run-rate forecast as the program budget.
Attribution coverage
The toggle shows what coverage becomes if the four largest unassigned keys were attributed to projects, which is usually the whole gap.
Kai: engineering questions, answered from the data
Ask which tool to standardize on. Get the math.
Kai reads the same PR and spend data and answers with its reasoning: which team has the best cost per PR, whether Cursor or Claude Code is faster for the platform team, and what the forecast says about this month’s token budget. It can also set the budget, so the decision and the control happen in one conversation.
- “Which teams have the highest AI coding tool ROI?”
- “Is Claude Code or Cursor faster for the platform team, and at what cost per PR?”
- “Are we forecast to overrun the engineering AI budget this month?”
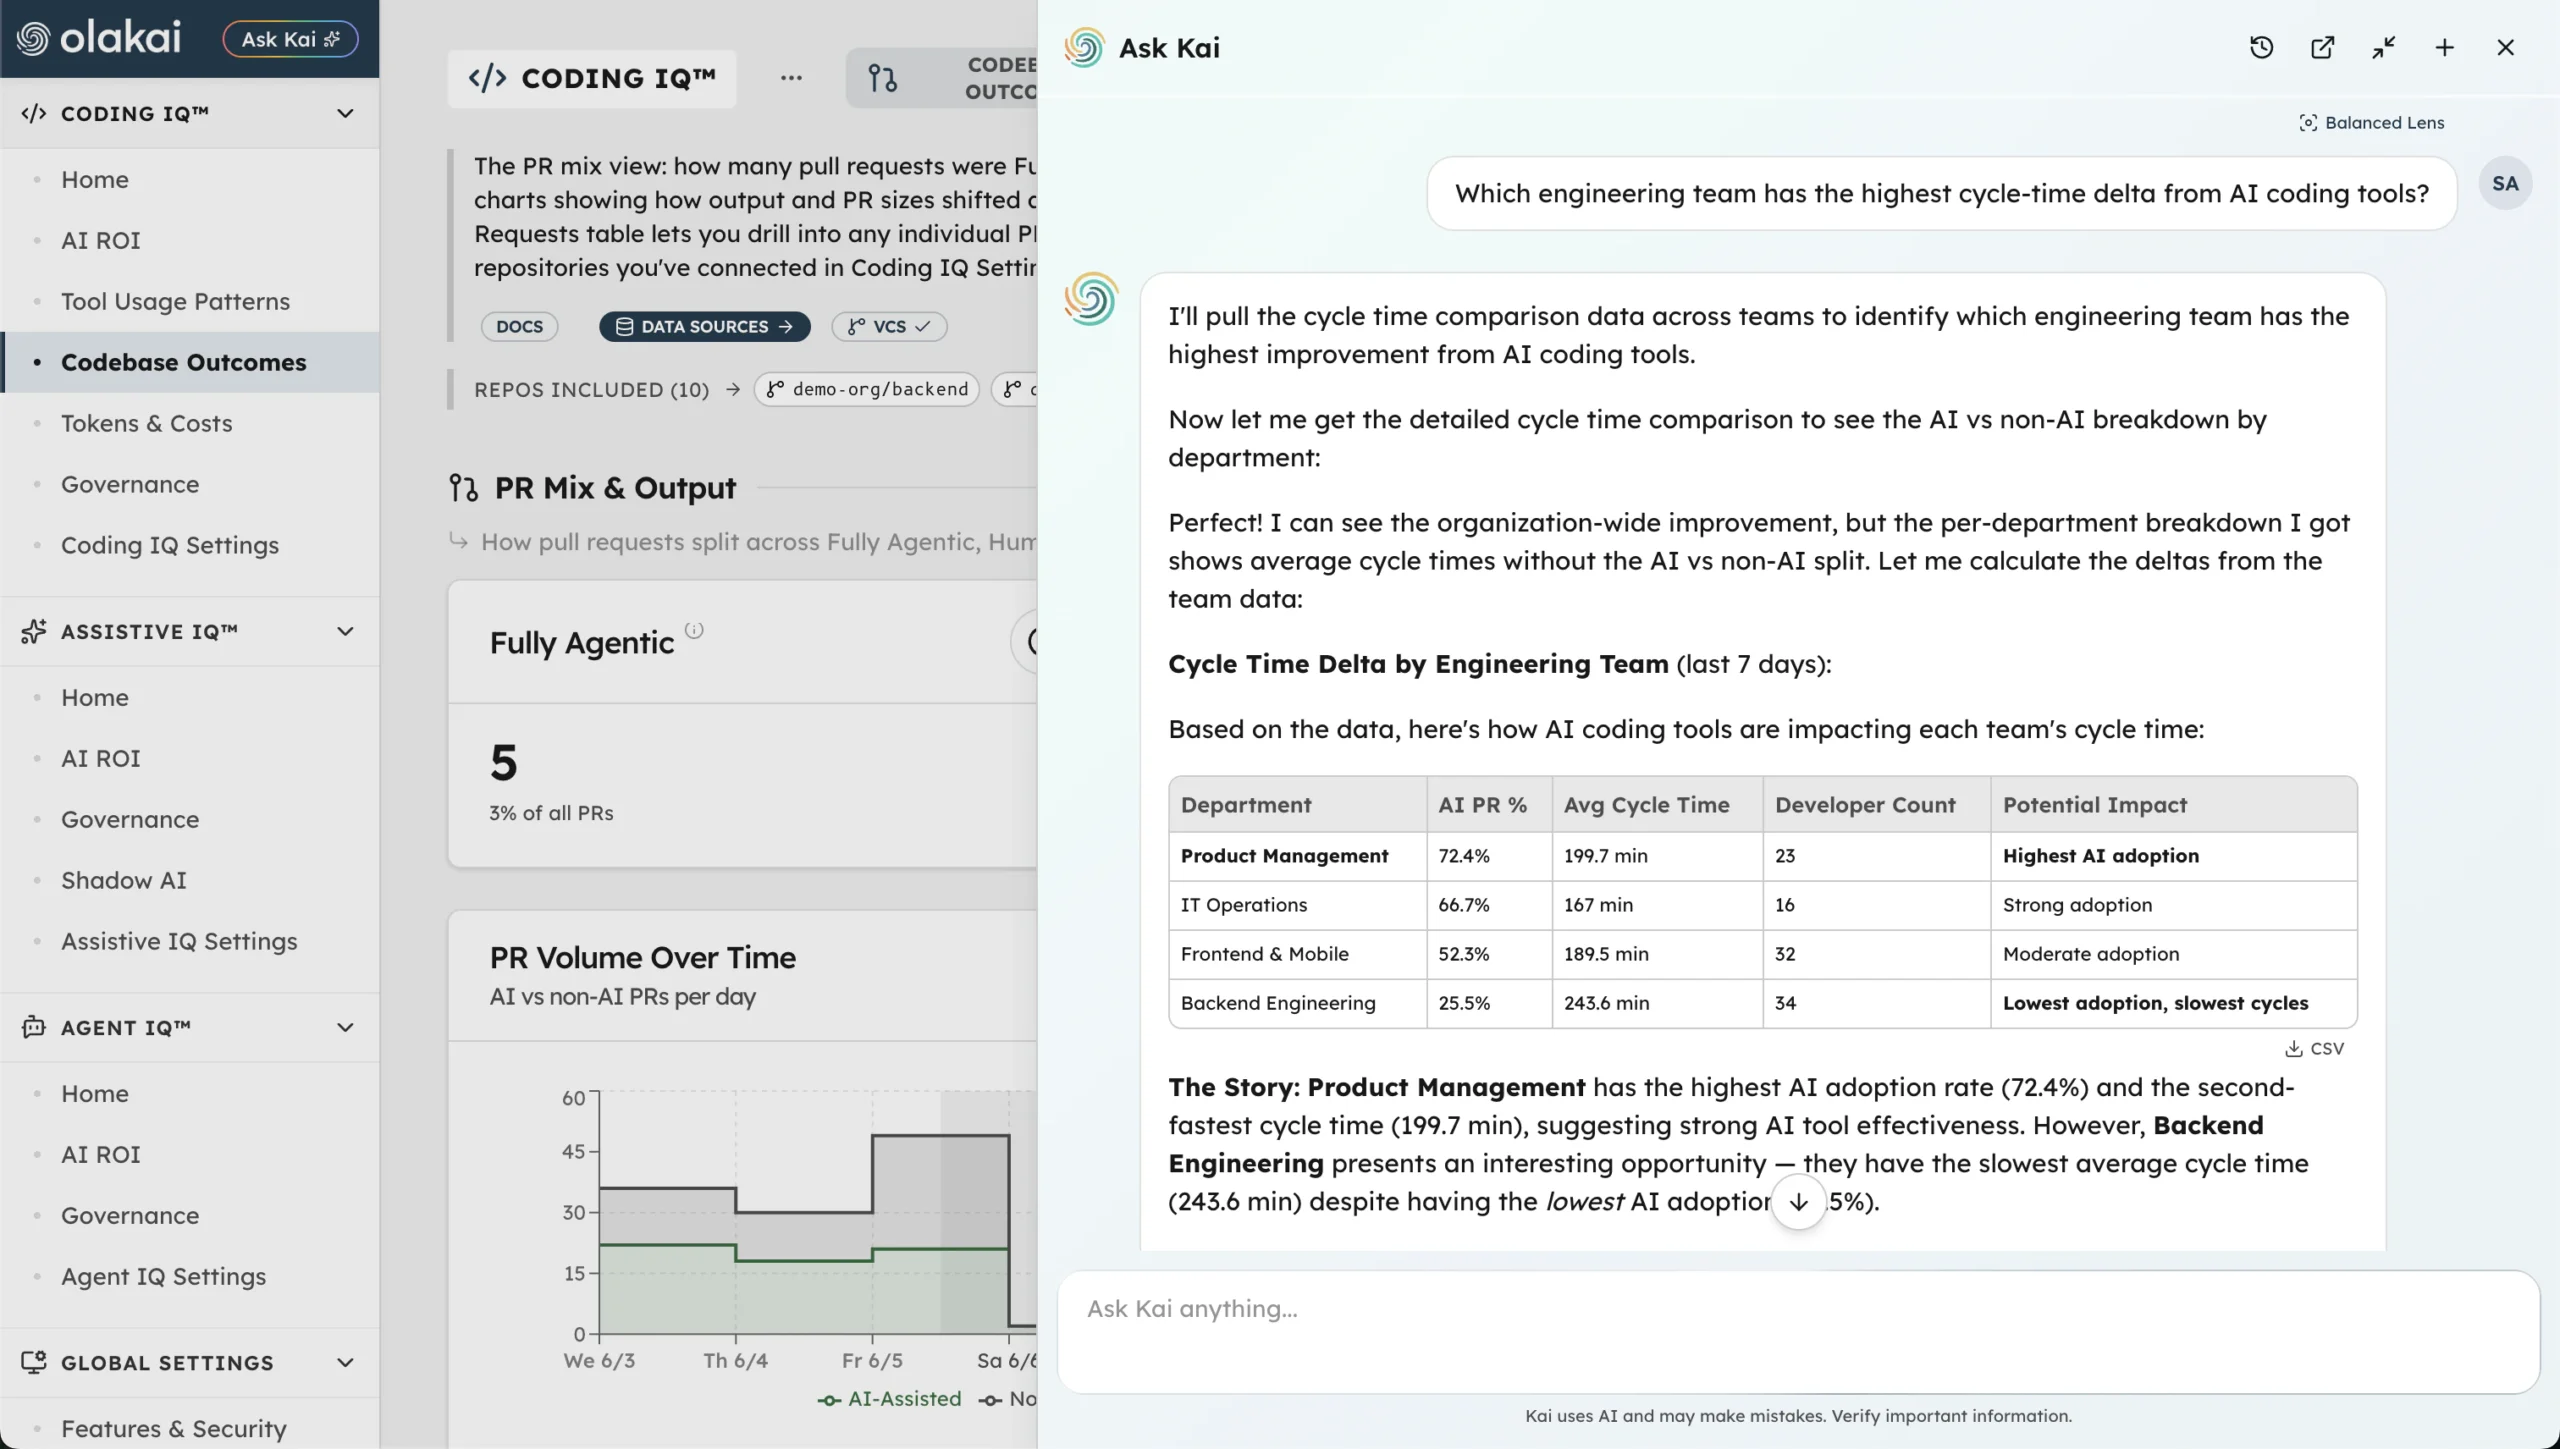
Olakai does not promise that AI makes your engineers 30% faster. It measures whether it did, on your repos, and tells you what it cost.
Related use cases
Engineering is where most of the tokens go. Measure it with the rest of the program.
“Are our AI coding tools making us faster, which ones, for whom, and at what cost per PR?”
The same data that measures engineering impact feeds the budgets, rolls up into program-level ROI, and keeps the coding agents inside governance. One platform, Olakai Agentic for engineering and Olakai Assistive for everyone else, connected through the integrations you already run.
Use case
AI ROI
Value created versus cost for every copilot, coding tool, and agent, rolled up to one number the board trusts.
Use case
FinOps for AI
Allocation by team and project, run-rate forecasts, and alerts before the overrun. Cost per PR, not cost per token.
Use case
AI Governance
Every tool and agent discovered, including shadow AI. Policy and DLP enforced at the point of use, audit trail kept.