
Picture the quarterly board meeting at a Fortune 500 company. The CFO pulls up a slide: $12 million spent on AI tools in the past year. Copilot licenses. Cursor seats. ChatGPT Enterprise. A handful of custom agents. Three pilots that turned into “ongoing experiments.” Then the question: What did we get for it? Silence. Not because the tools aren’t being used — they are, more than anyone expected. Because nobody in the room can answer that question with a number. That’s the gap this post is about.
Enterprise AI measurement today exists at three layers: tool usage and adoption (who’s using what), workflow and productivity impact (are they faster), and business outcomes (did revenue, margin, or retention actually move). The problem is structural. Every measurement tool on the market lives at layer one or two — and calls it ROI. None of them connect to layer three. That’s not a product limitation. It’s a measurement philosophy problem.
1. Microsoft Copilot Analytics
Microsoft’s built-in Copilot Dashboard tracks M365 Copilot usage across the organization: prompts submitted, documents generated, meetings summarized, emails drafted. It’s native to the Microsoft ecosystem, which means zero integration effort and instant visibility for IT admins. For a 10,000-person org paying $30–60 per seat per month, that visibility matters — you’re looking at $3.6 to $7.2 million a year in Copilot licensing alone.
The weakness is fundamental. The dashboard provides a 28-day aggregated view with no per-user ROI correlation and no connection to business outcomes. You know Copilot is being used. You know how often. You have no idea whether it’s helping. Microsoft also disclosed a metric computation bug that underreported email engagement data for nine months — a quiet reminder that vendor-reported metrics aren’t always reliable, even from the vendor itself. Activity is not impact.
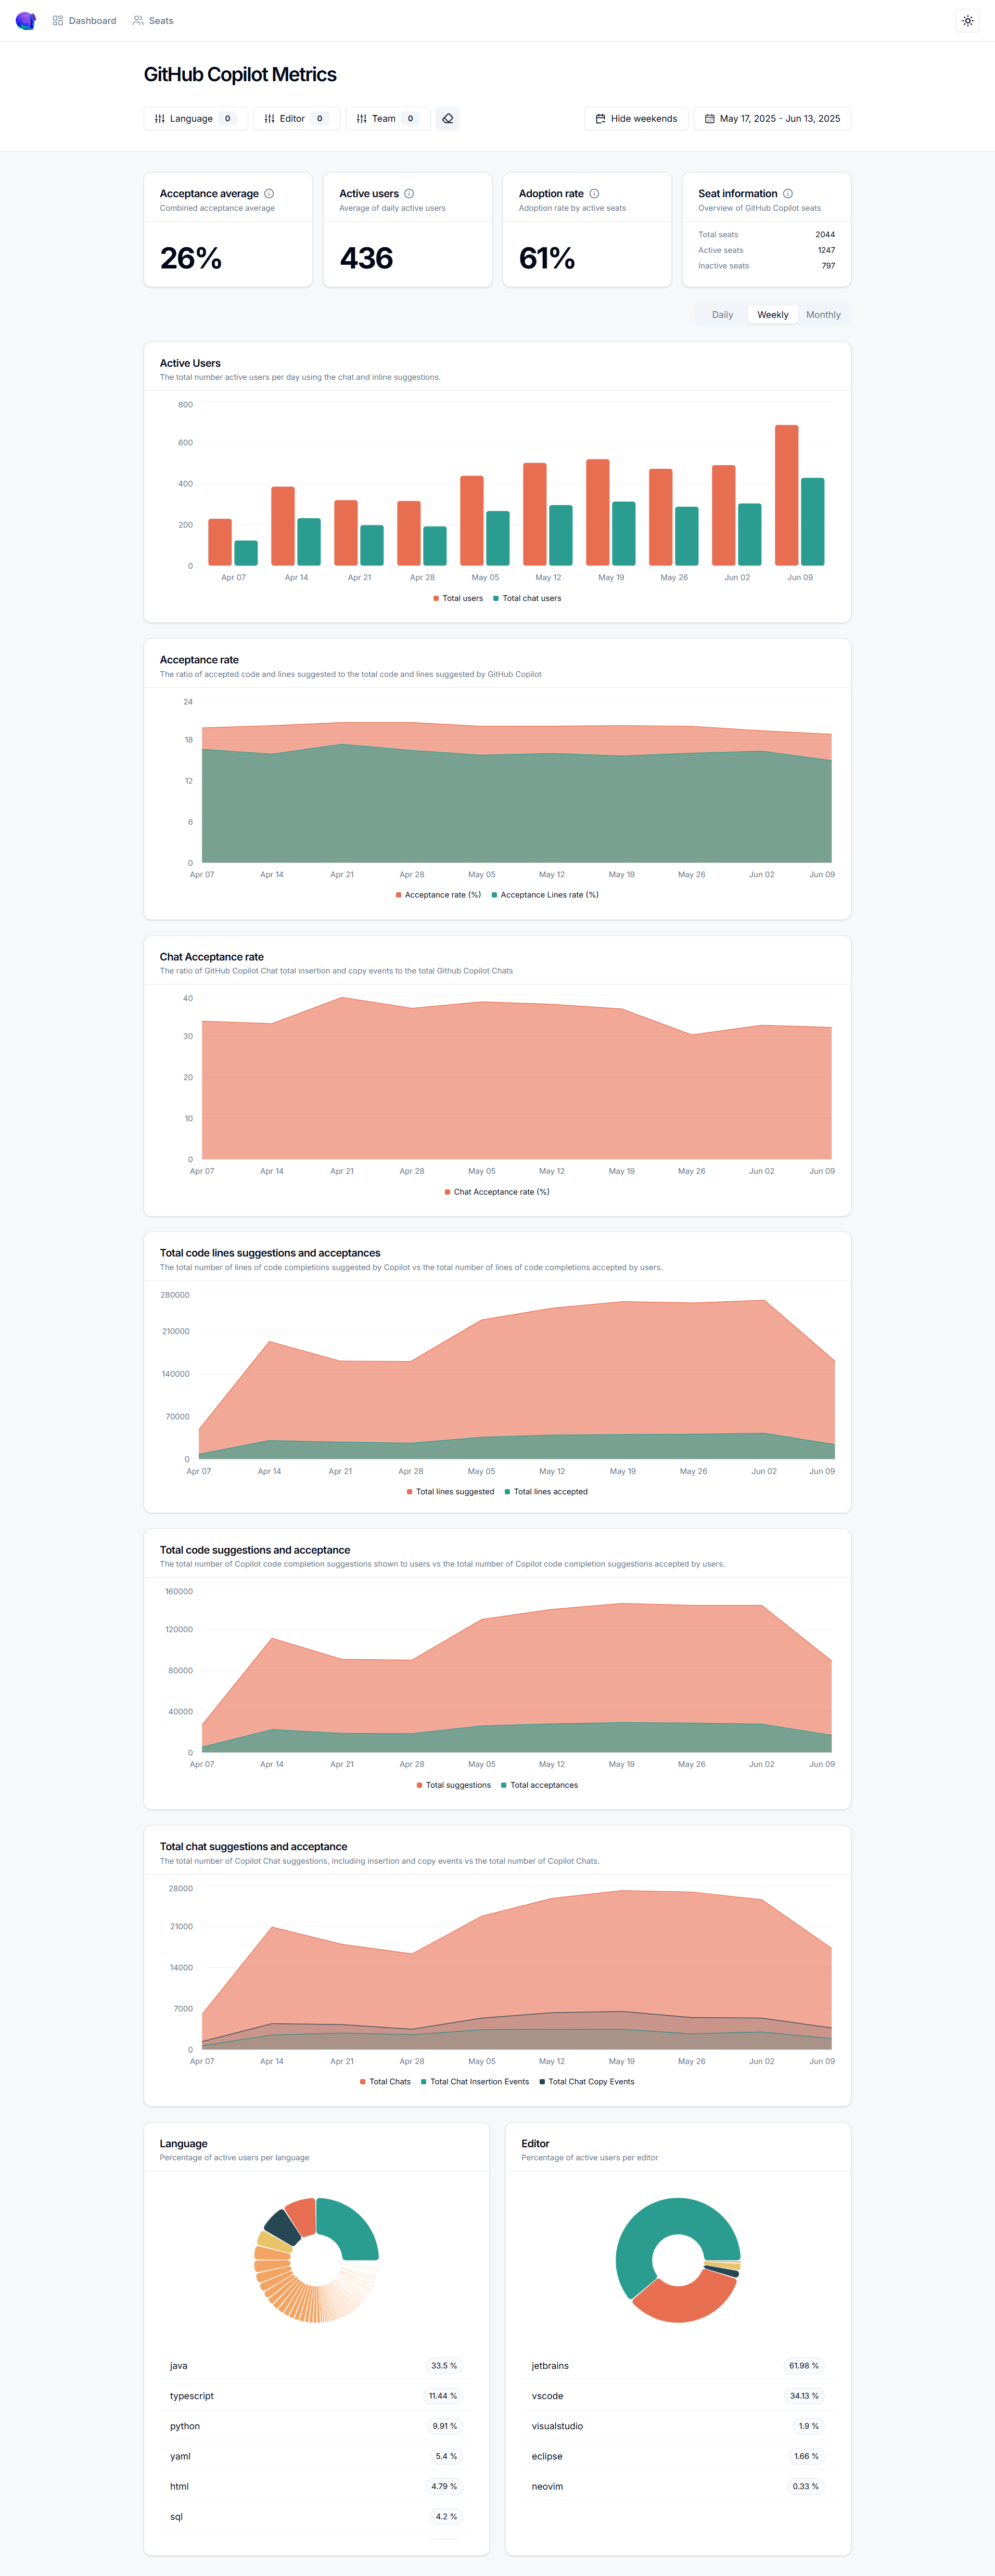
2. GitHub Copilot and GitLab Duo Metrics
GitHub Copilot reports code suggestion acceptance rates (averaging 27–30%), time saved per developer (roughly 3.6 hours per week), and suggestion frequency across your engineering org. GitLab Duo offers similar dashboards for its AI features. Developer teams love this data. Engineering leaders use it to justify expansion, track adoption curves, and identify which teams are getting the most value from AI-assisted coding.
The limitation is scope. These tools measure developers — and only developers using that specific tool. Your marketing team running campaigns through ChatGPT? Invisible. Your finance team using Gemini for forecasting models? Invisible. Your legal team reviewing contracts with Claude? Invisible. And “acceptance rate” is a product metric, not a business metric. A 30% acceptance rate tells you developers kept 30% of suggestions. It says nothing about whether those suggestions shipped faster, reduced bugs, or moved a revenue number. Dev-only measurement in an enterprise where every department uses AI is a partial answer at best.
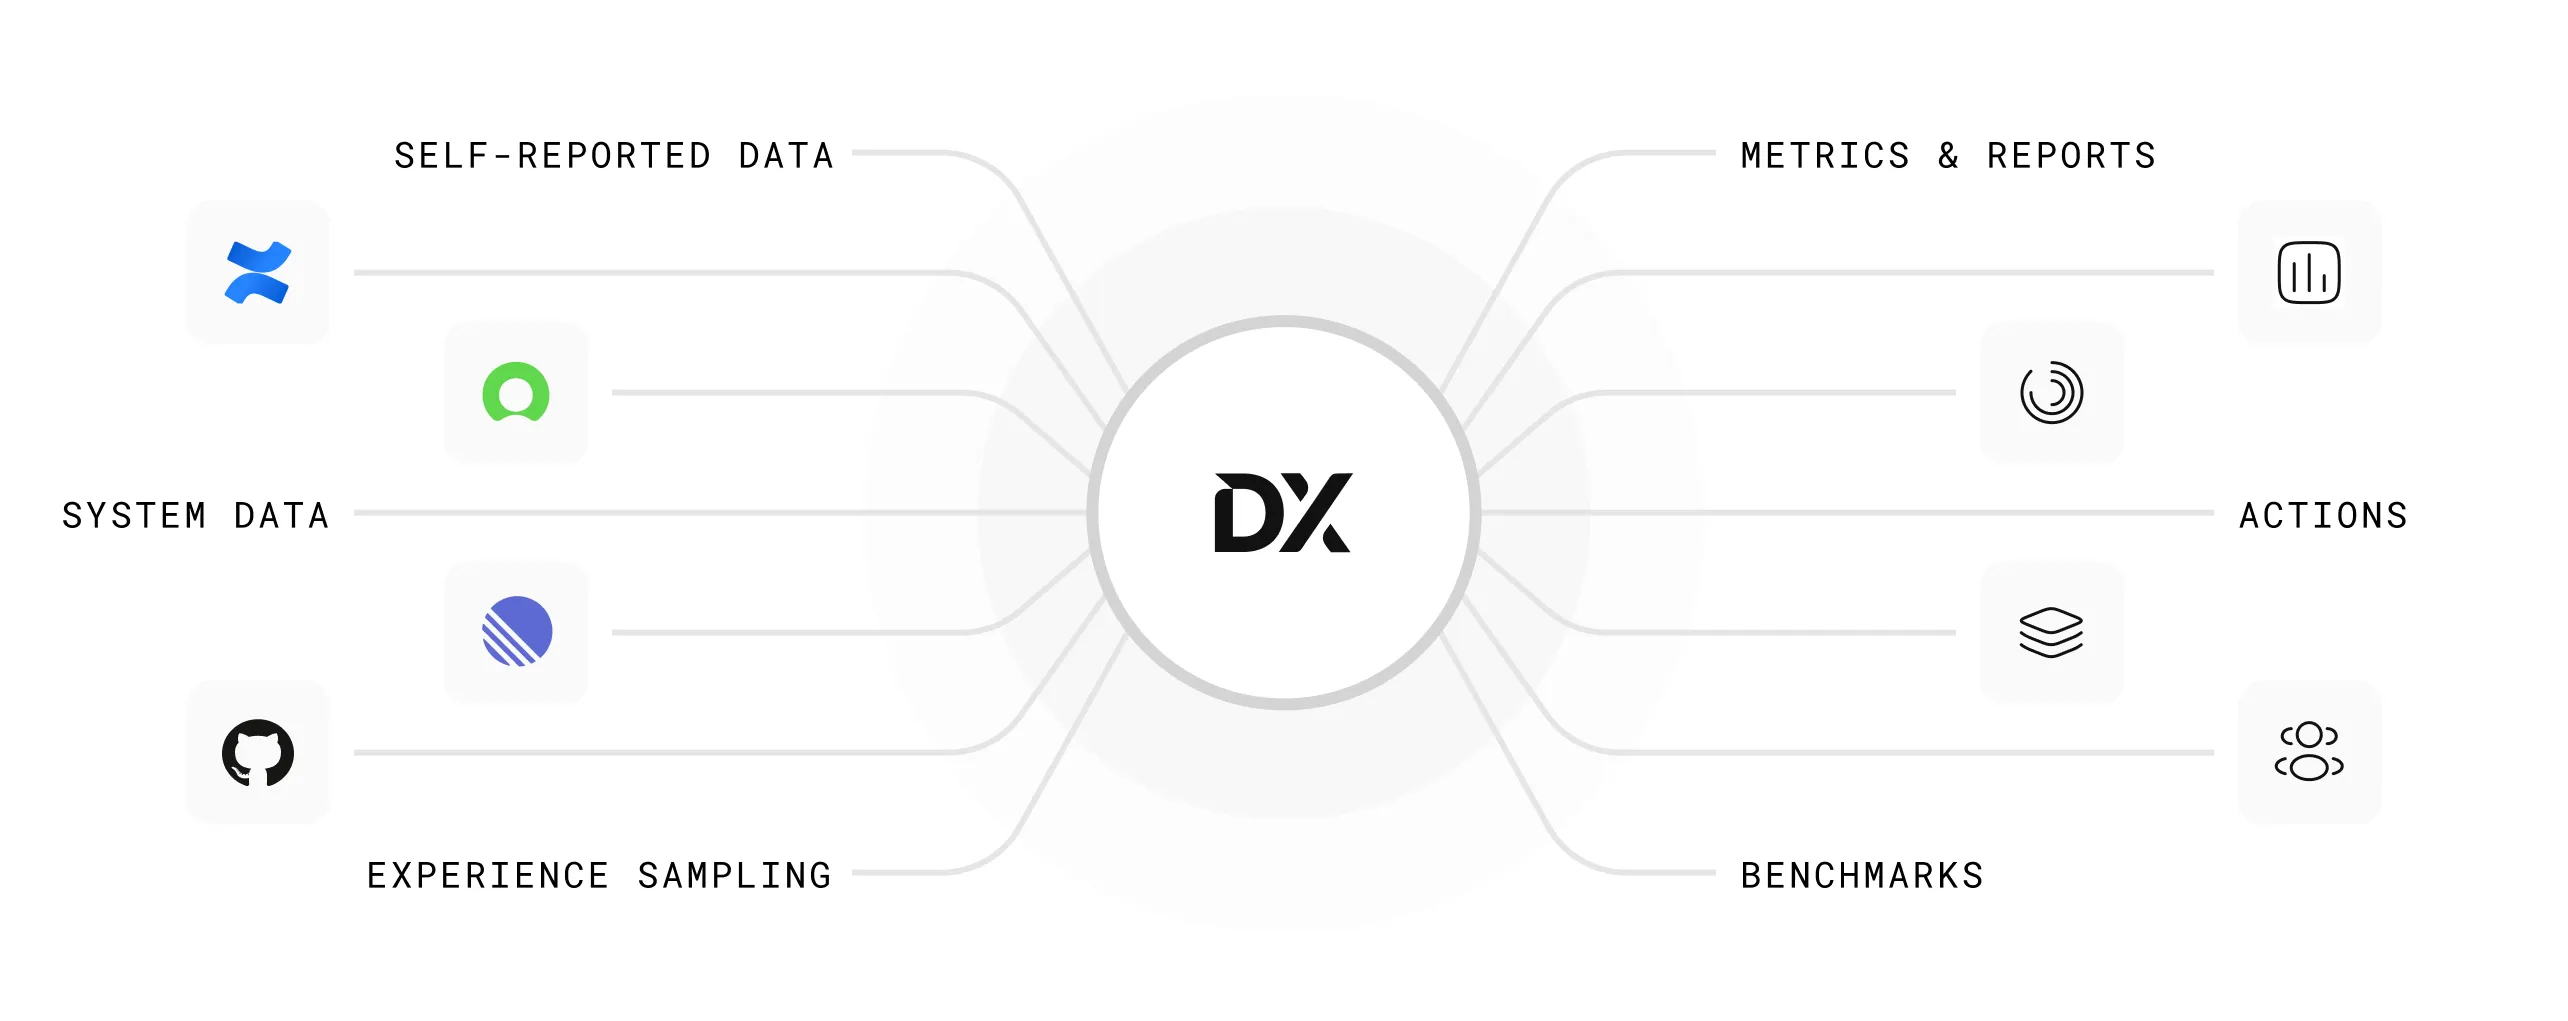
3. GetDX, Pluralsight Flow, and LinearB
These platforms measure developer productivity through DORA metrics, developer experience scores, PR cycle time, and deployment frequency. They’re legitimate engineering intelligence tools — McKinsey’s 2025 State of AI report found that 88% of organizations have adopted AI, but only 39% can report any EBIT impact. These developer platforms didn’t cause that gap, but they don’t close it either.
The positioning is explicit: these are developer productivity tools, not AI ROI platforms. Some vendors have started rebranding DORA metrics as “AI measurement,” adding overlays that compare AI-assisted versus non-AI-assisted PRs. That’s useful context for an engineering VP. It’s not what the CFO means when she asks about AI ROI. DORA metrics existed before AI coding tools did. Relabeling them doesn’t make them an AI measurement strategy.
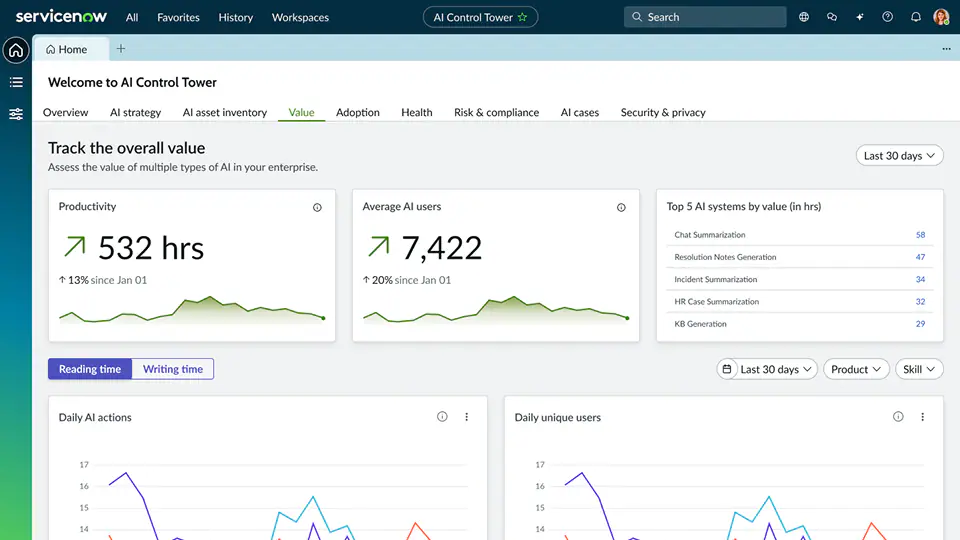
4. Workday and ServiceNow Built-In AI Analytics
Both Workday and ServiceNow — along with Salesforce Einstein, SAP Joule, and dozens of other enterprise platforms — now report on their own AI feature usage. Workday shows you AI-generated job descriptions and skills recommendations. ServiceNow tracks virtual agent deflection rates and case summarization usage. The strength is obvious: zero integration effort, immediate availability, and perfect accuracy within that vendor’s walls.
The weakness is equally obvious: each platform is a silo. Workday tells you about Workday AI. ServiceNow tells you about ServiceNow AI. Salesforce tells you about Salesforce AI. Nobody tells you about all of them together. For an enterprise running AI across fifteen platforms, you’d need to log into fifteen dashboards, normalize fifteen different metric definitions, and somehow reconcile them into a single view. Most don’t try. The result is that enterprise AI measurement defaults to whoever shouts the loudest in the vendor review.
5. Custom BI Dashboards (Tableau, Power BI)
This one isn’t a product — it’s a pattern. Many enterprises, frustrated by the limitations above, decide to build their own AI measurement dashboard. Pull API data from each AI tool into a data warehouse, model it in dbt or Databricks, visualize it in Tableau or Power BI. The appeal is total customization: you define the metrics, you own the schema, you control the narrative.
The reality is expensive and slow. Enterprise-grade BI implementations take three to six months for multi-source deployments, and first-year costs for a 5,000-person org run between $510K and $1.2 million — often more than the AI tools being measured. There’s no standardized schema for AI usage data, no external benchmarks to compare against, and every API change from every vendor breaks something. Most custom dashboards become the responsibility of one or two analysts, and when they leave, the dashboard dies with them. You’ve built a measurement tool that costs more than what it measures.
The Real Problem: A Measurement Philosophy Gap
Each of the tools above measures AI in isolation. Microsoft measures Microsoft. GitHub measures GitHub. Workday measures Workday. The custom dashboard tries to stitch them together but creates a maintenance burden that’s unsustainable at enterprise scale. Meanwhile, the actual ROI question is cross-enterprise: which teams adopted which tools, what changed in their output, and did any of it move a business metric?
That question requires connecting three dots: adoption data (who’s using what), productivity signals (what changed in their work), and business outcomes (did it matter). Forrester’s 2026 Predictions report found that fewer than one in three AI decision-makers can tie AI value to P&L changes. Not because they aren’t trying — because their tools don’t connect those layers. That’s not a product gap. It’s a measurement philosophy gap. You can’t vibe-code accountability.
What Olakai Does Differently
This is the problem we built Olakai to solve. Not another vendor-specific dashboard. Not another developer productivity overlay. A vendor-neutral analytics and governance platform that works across your entire AI stack — ChatGPT, Copilot, Gemini, Cursor, Claude, custom agents, and the AI features embedded in your SaaS applications — and connects what’s being used to what it’s actually producing.
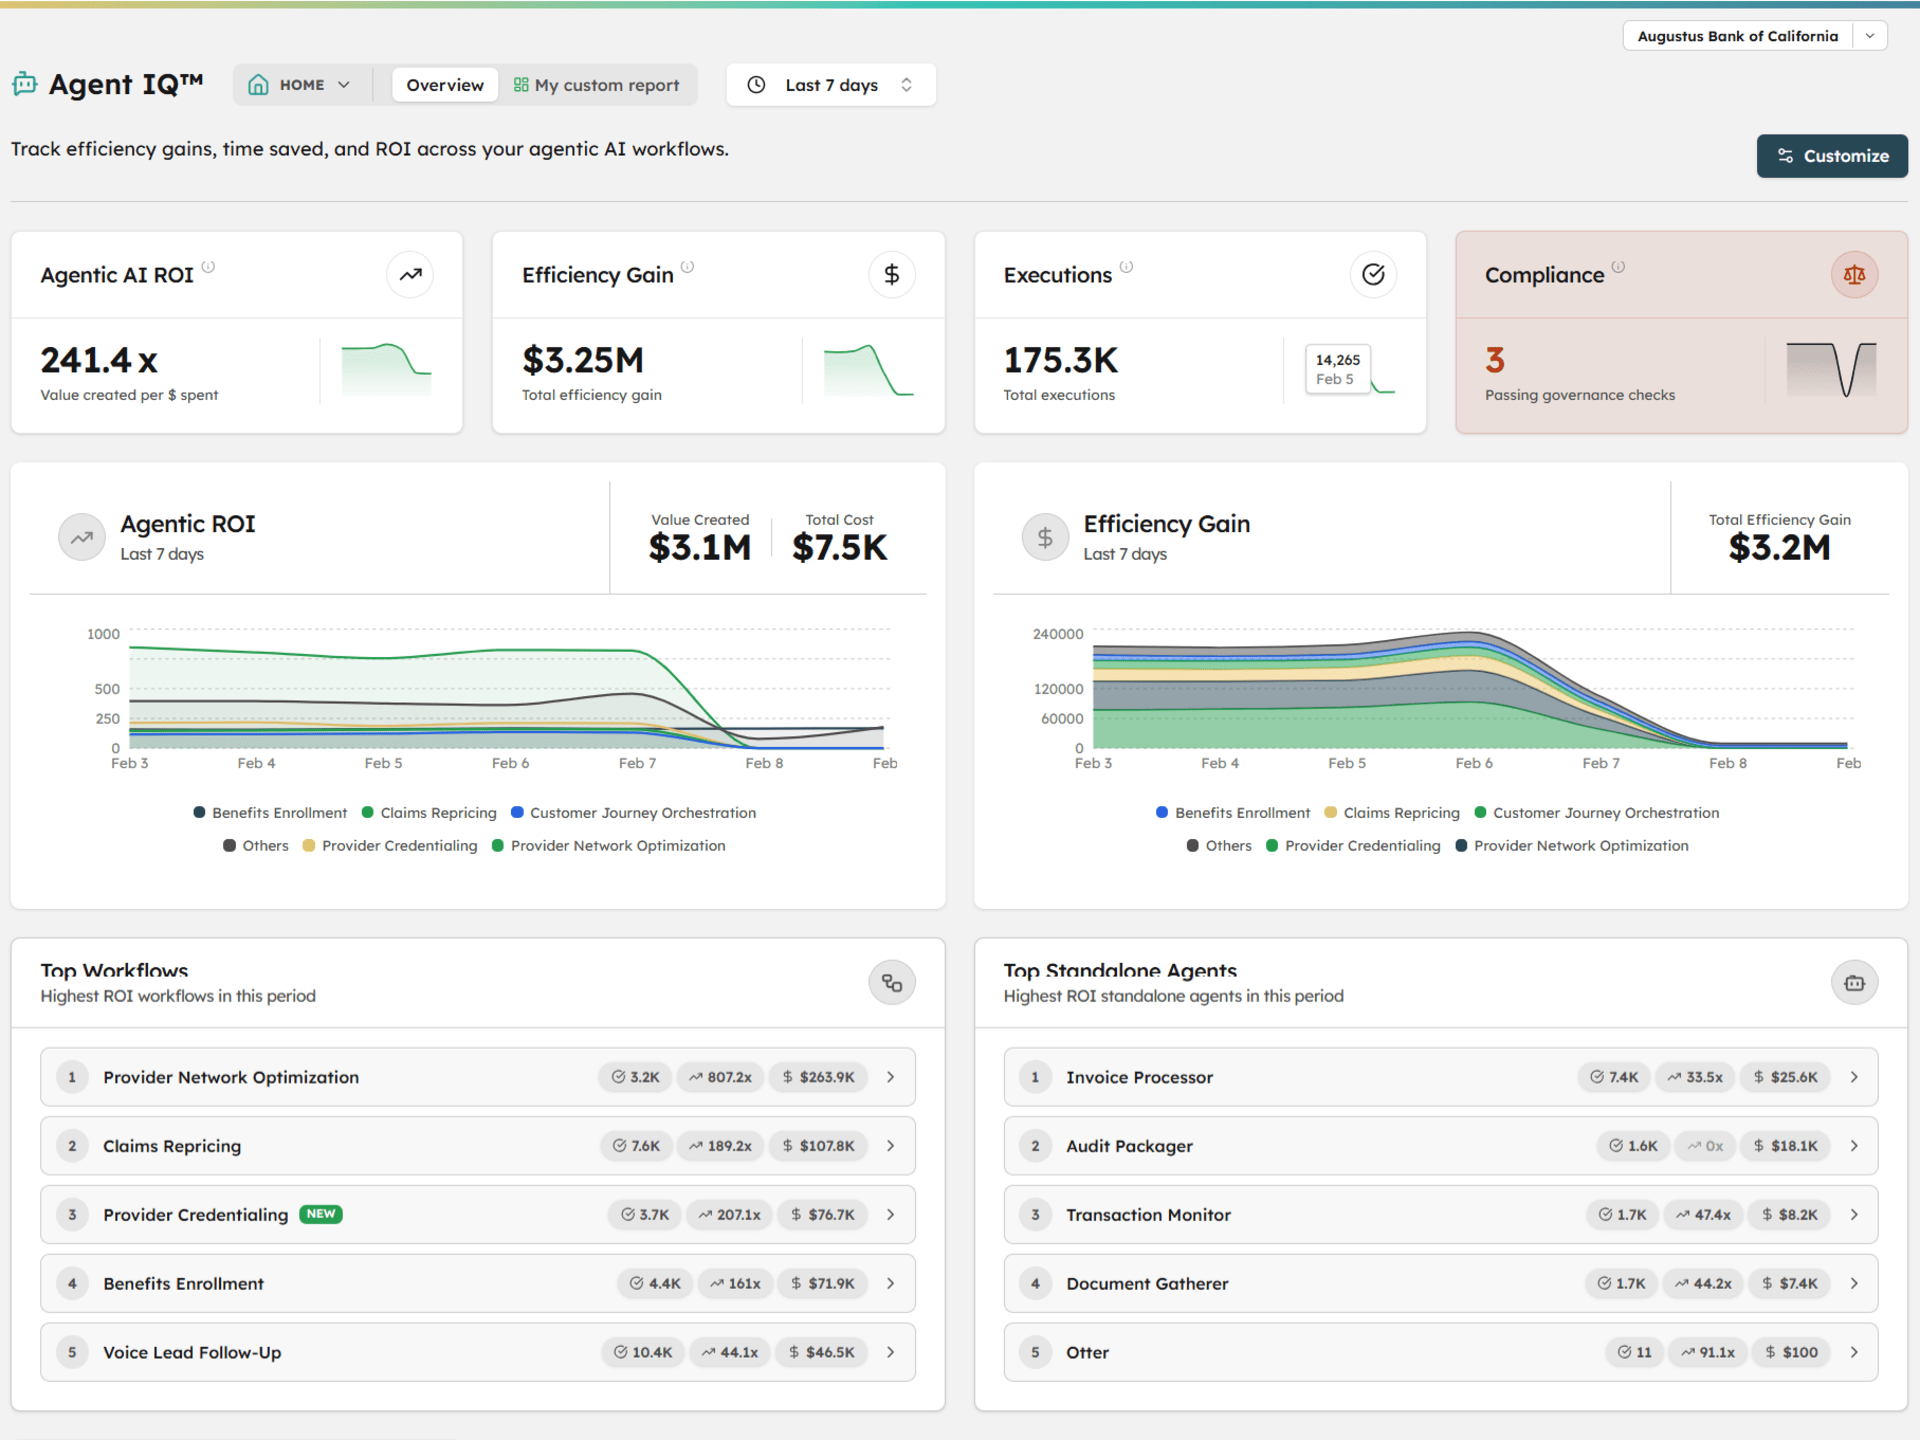
Olakai is structured around three product lines, each covering a category that the tools above treat in isolation. Assistive IQ measures adoption, productivity, and shadow AI across chatbots and copilots — deployed through a Chrome extension that takes minutes, not months. Coding IQ connects to your GitHub org and AI coding tool providers to unify cycle time data, AI-assisted PR rates, developer adoption cohorts, and cost-per-PR across Copilot, Cursor, Claude Code, and Windsurf in a single view. Agent IQ tracks custom agentic workflows with execution metrics, success rates, and cost-per-execution tied to business KPIs you define. None of these exist in separate tools. They exist in one platform, measured against the same outcomes.
The difference isn’t just breadth — it’s the connection between layers. Every tool in this article measures activity. Olakai connects that activity to business outcomes through custom KPIs that map AI usage to the metrics your CFO actually reports on: revenue influenced, cost avoided, time recaptured, risk reduced. When the board asks what $12 million in AI spend produced, Olakai is the platform that gives you the answer — not a usage chart, not an acceptance rate, but a number tied to a business result.
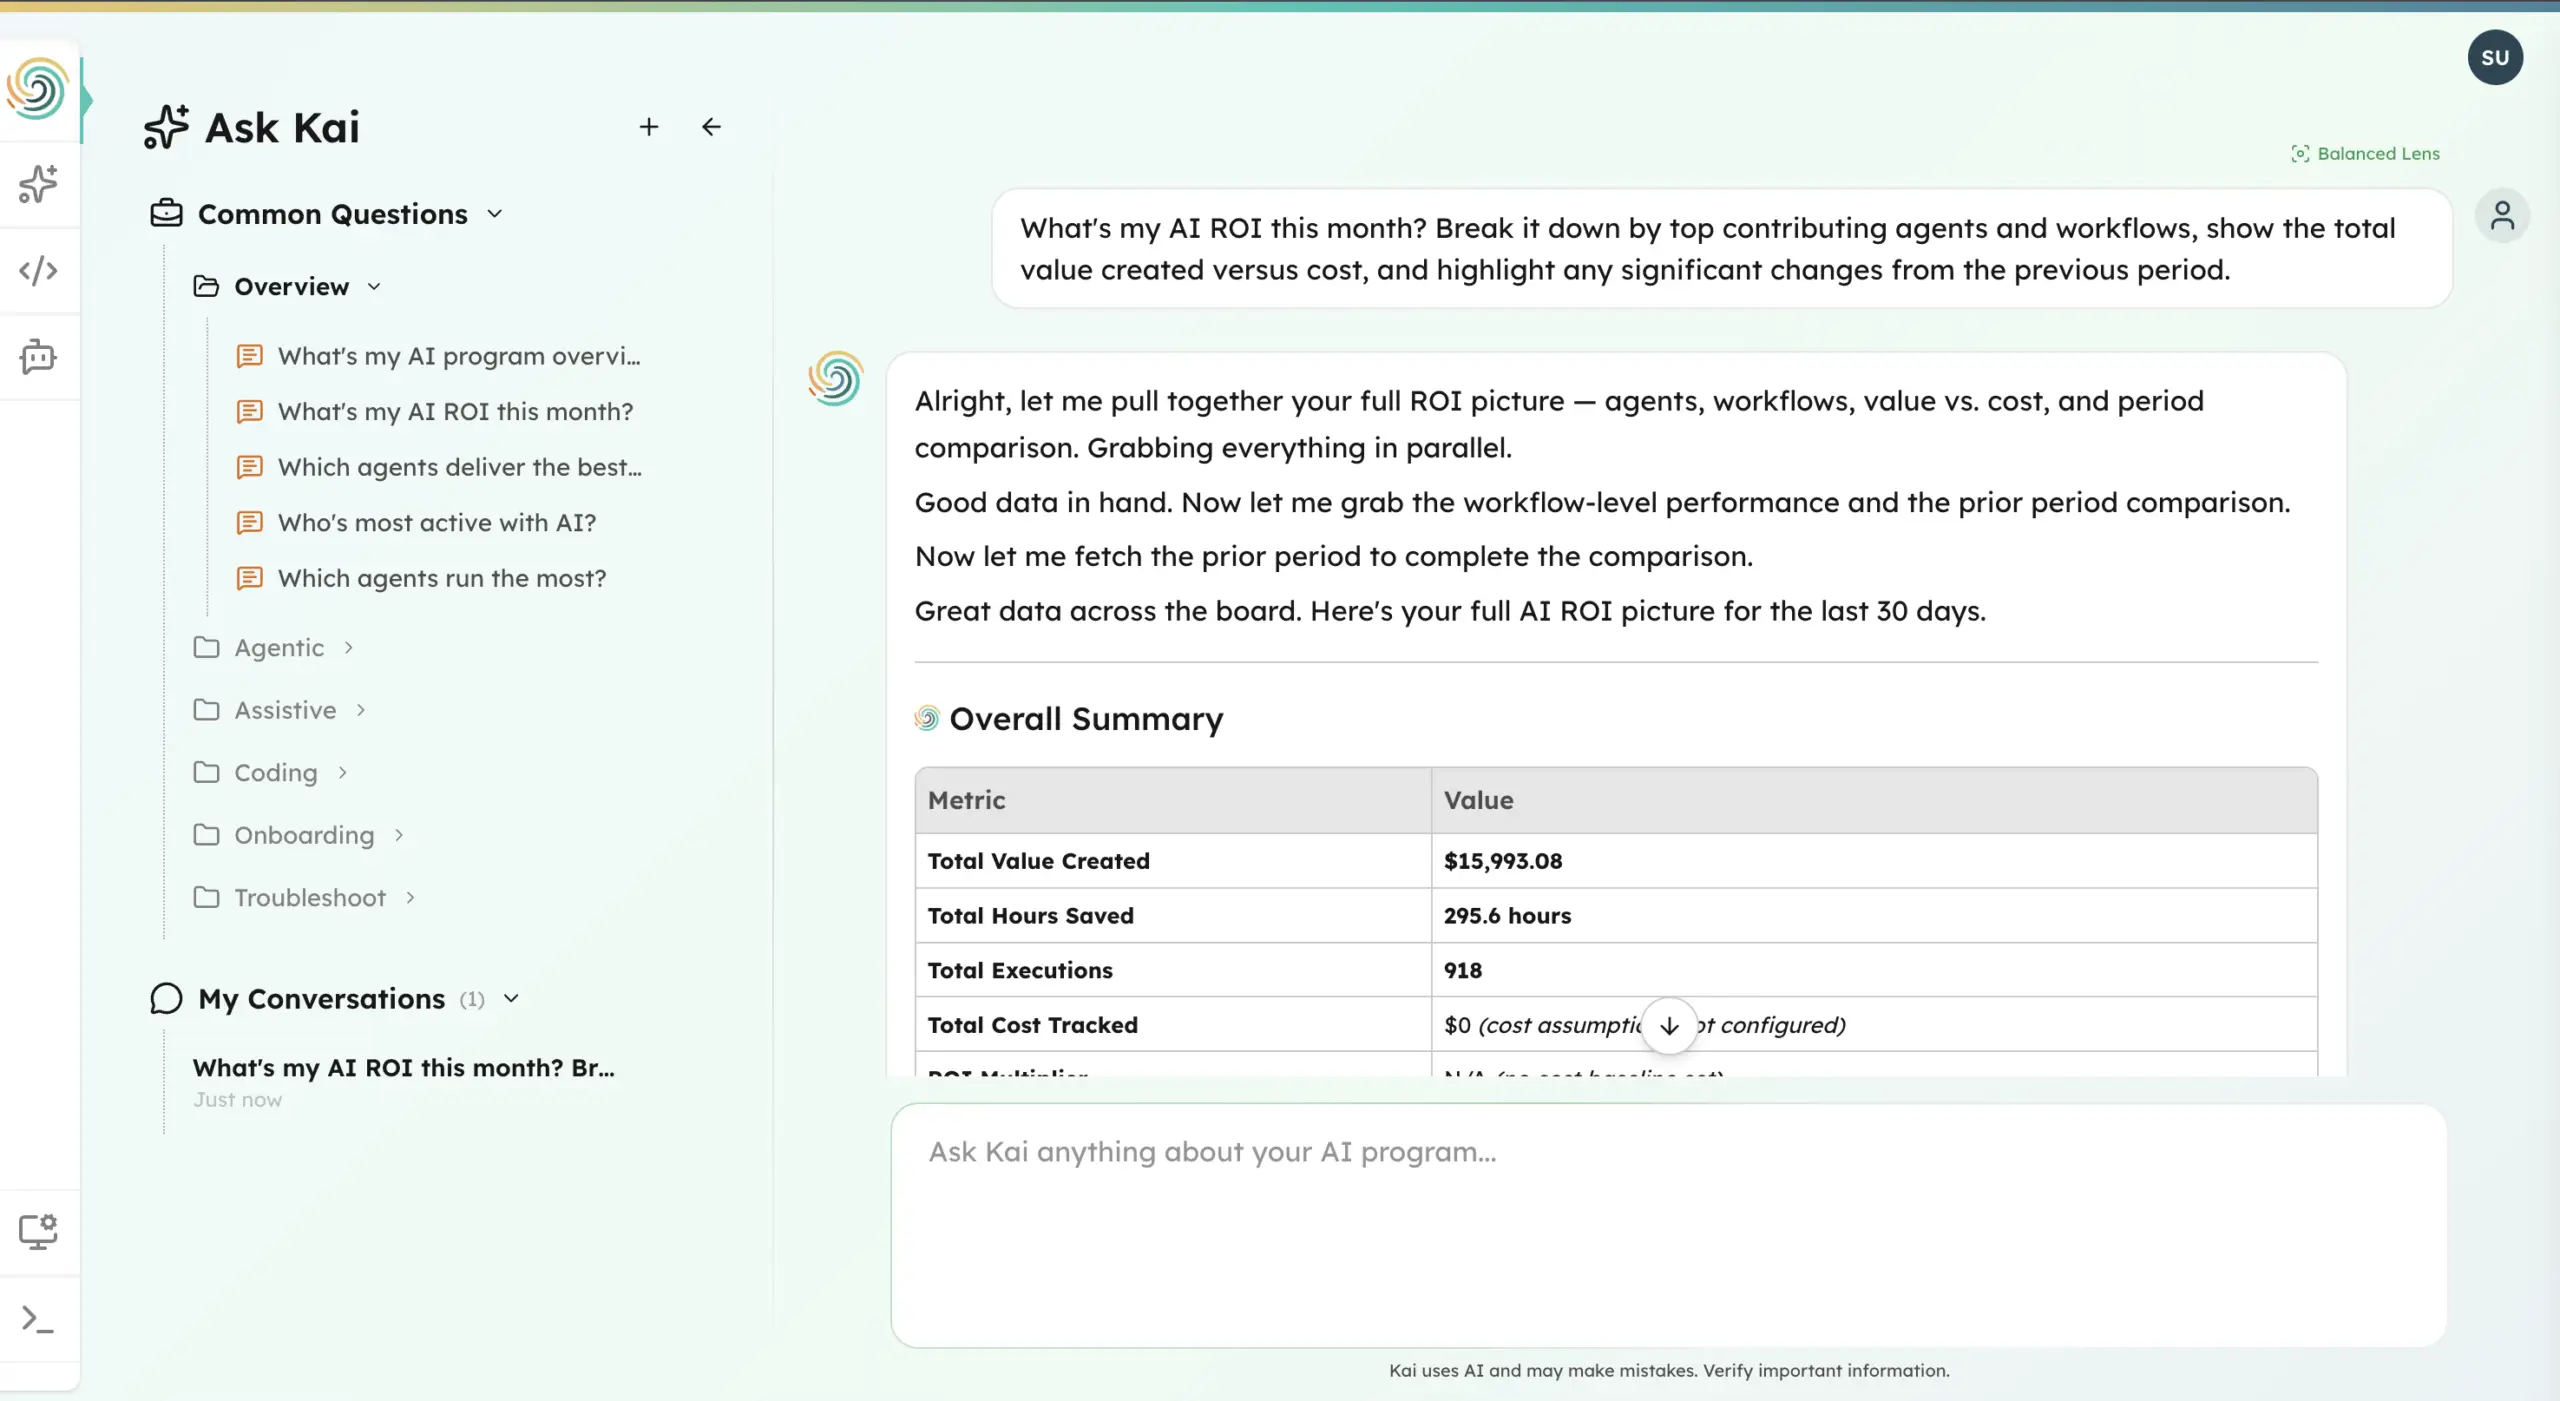
We’re not replacing the tools above — most of our customers use several of them. Microsoft Copilot Analytics still tells you how Copilot is being used. GitHub Copilot Metrics still shows acceptance rates. ServiceNow’s AI Control Tower still tracks its own AI features. What none of them do is answer the cross-enterprise question: across all of these tools, all of these teams, all of these investments — are we getting ROI, and where? That’s the layer Olakai provides. And with Kai, anyone on the team can ask that question in plain language and get a reasoned, data-backed answer in seconds — no analyst required, no dashboard to build.