The Platform | The Products » Olakai Agentic · Olakai Assistive
See, forecast, and control your AI coding tools. Maximize the ROI.
AI coding tools are now usage-based. Spend is volatile, and most leaders cannot see what it costs or what it returns. Coding IQ gives you both, and turns it into measurable ROI. We provide this. With clear evidence.
Out of the box integrations
Budgets & Forecasts
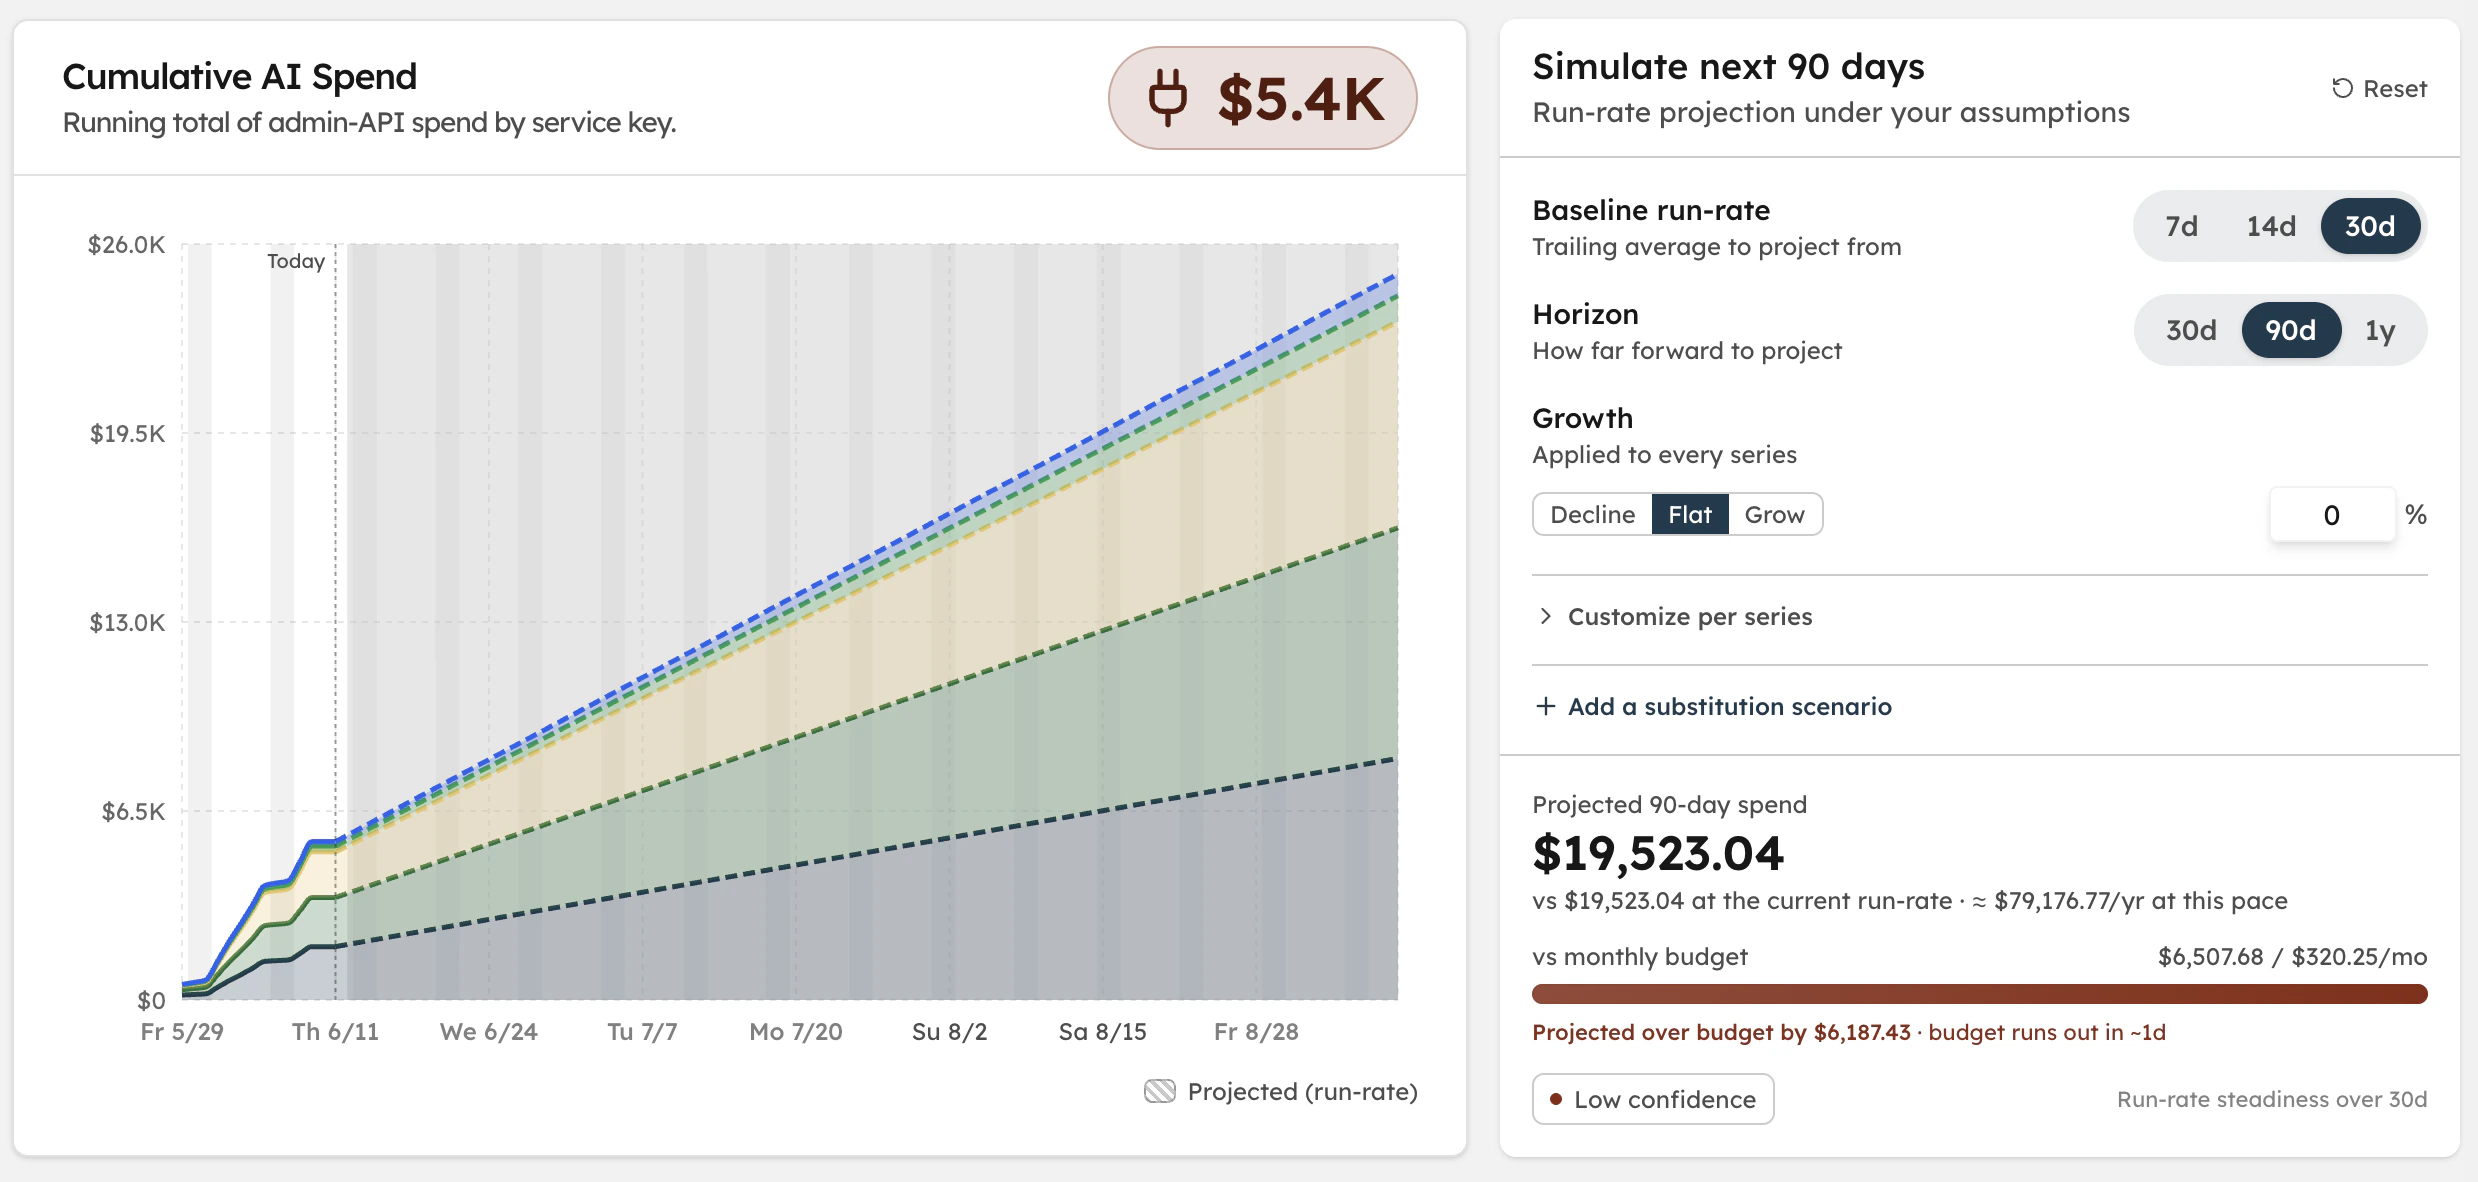
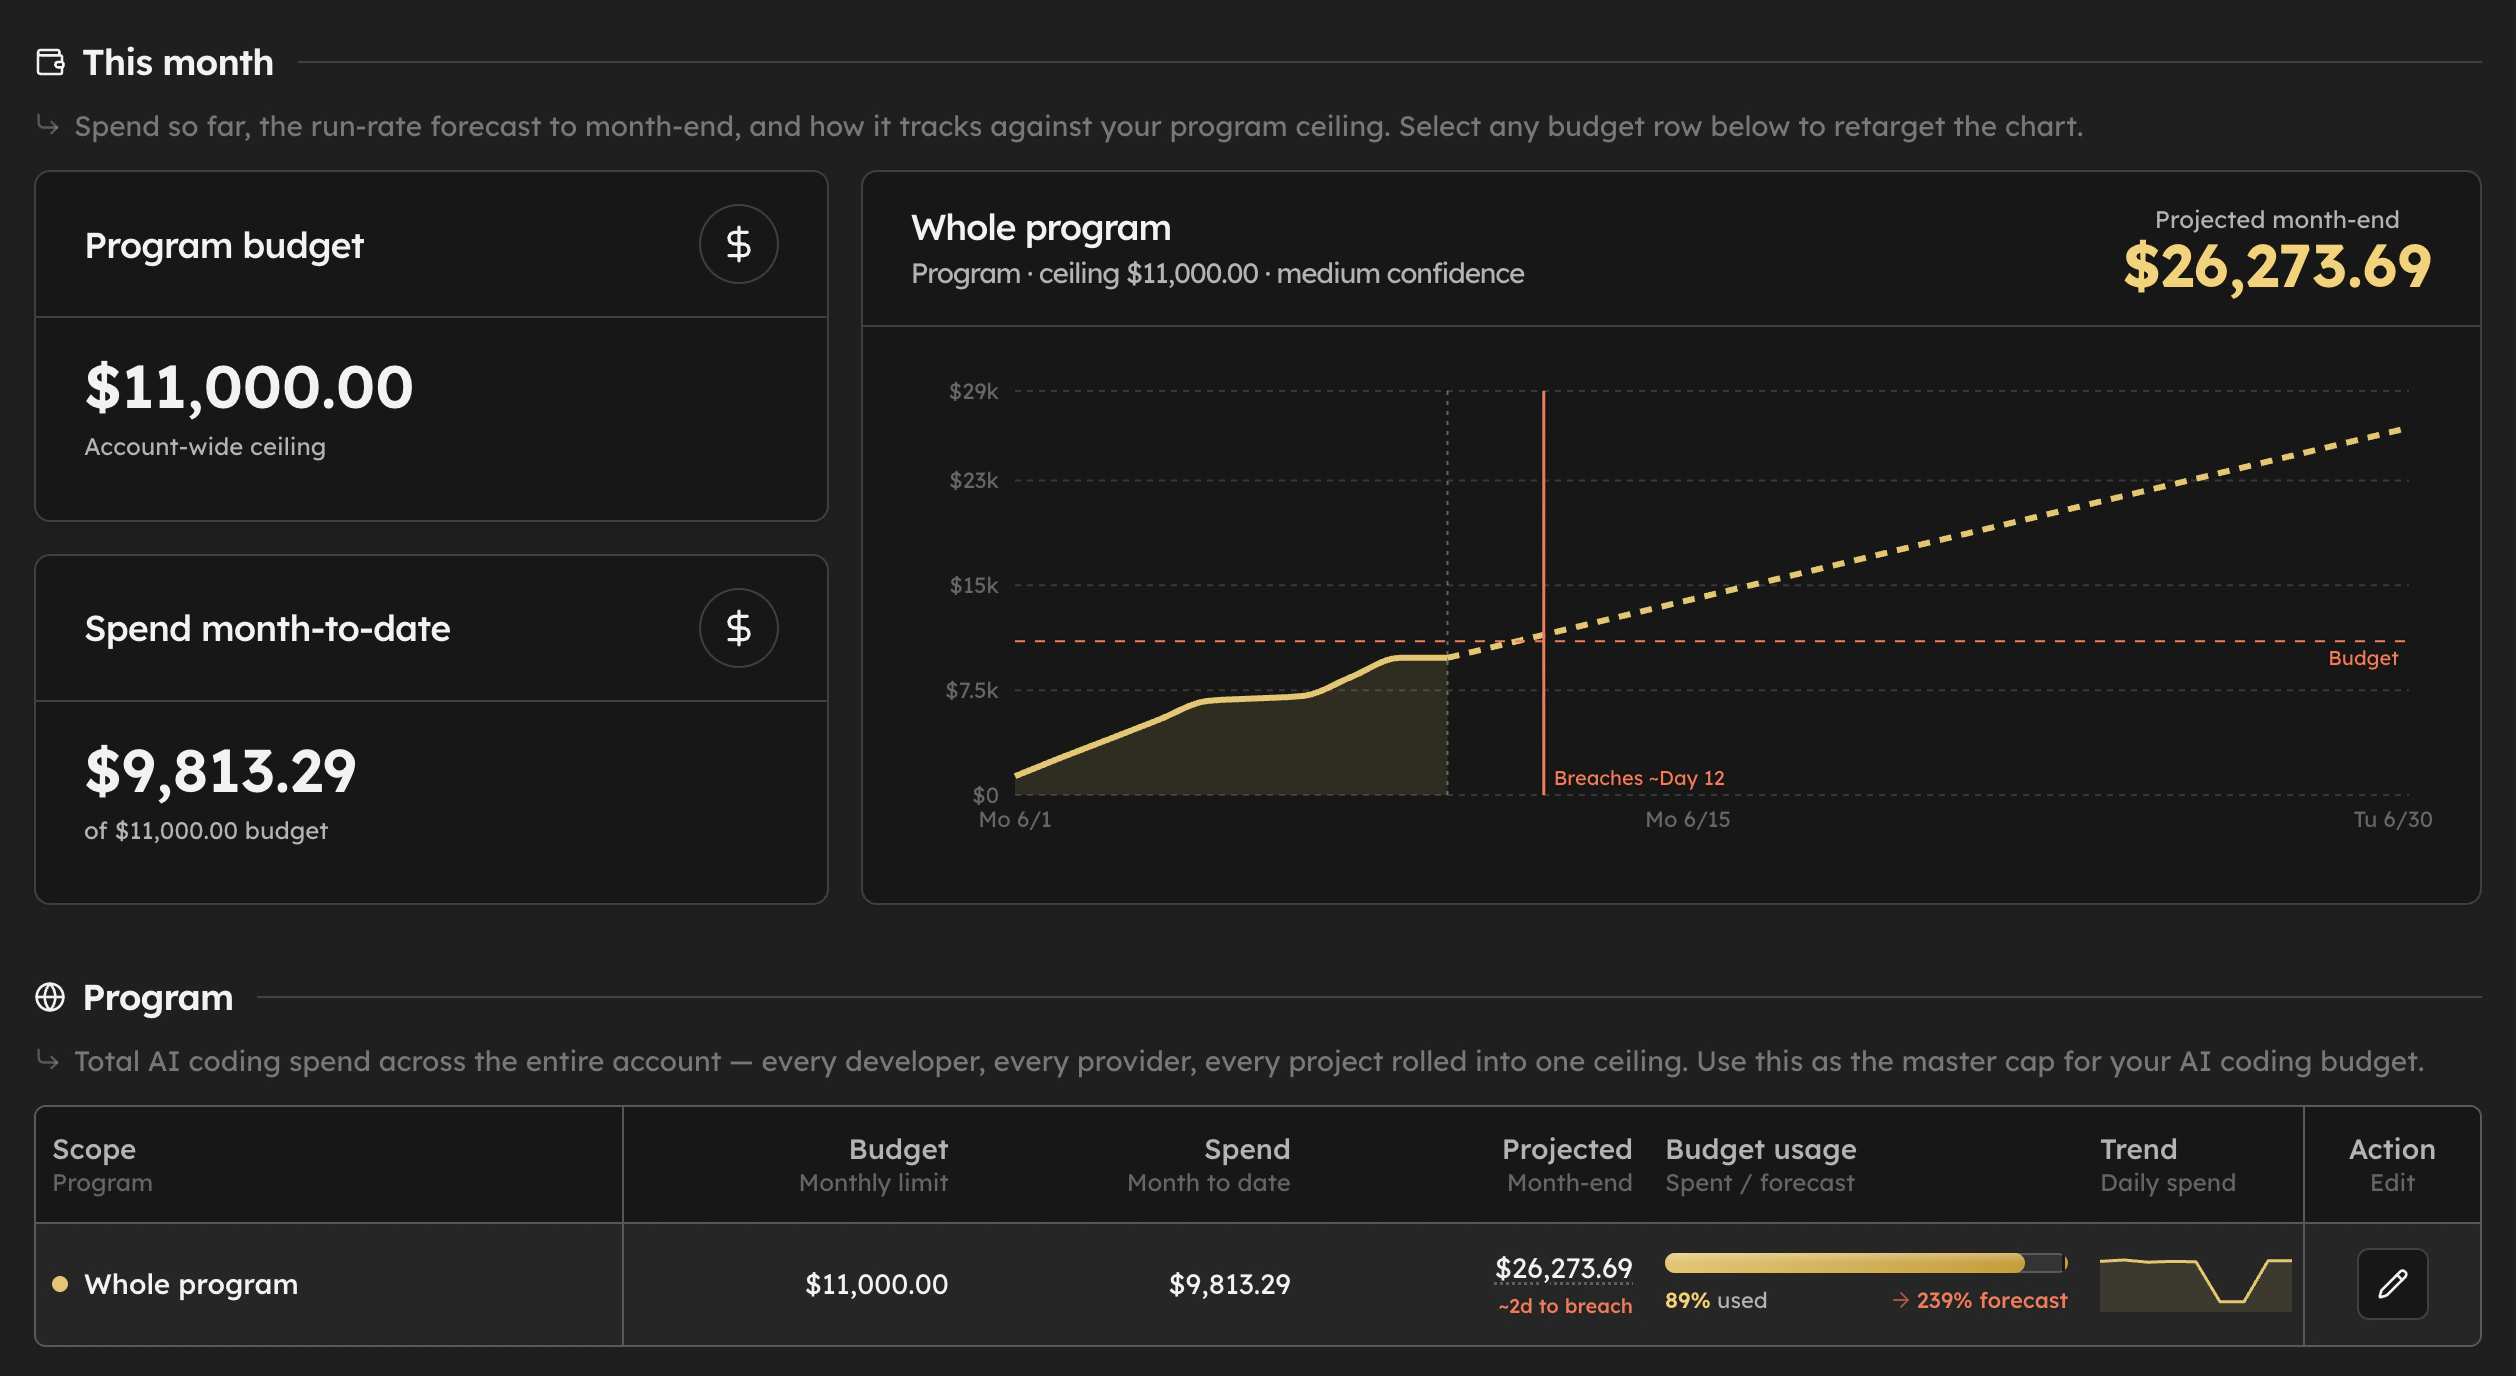
Forecast month-end spend. Set budgets. Get alerted before you overrun.
Set monthly limits across six overlapping lenses – Program, Provider, Developer, Persona, Department, and Project – so the same dollar rolls up to a developer, their team, and the whole account. A daily job projects month-end spend from your run-rate and fires an alert the moment a budget is breached or forecast to breach, before the invoice arrives.
- Run-rate month-end forecast with a confidence level — a projection, not a guarantee
- Threshold alerts (e.g. 80% / 100% of limit) and forecast-breach alerts
- Simulate the next 30 days — model growth or shift spend between providers
PR Analysis
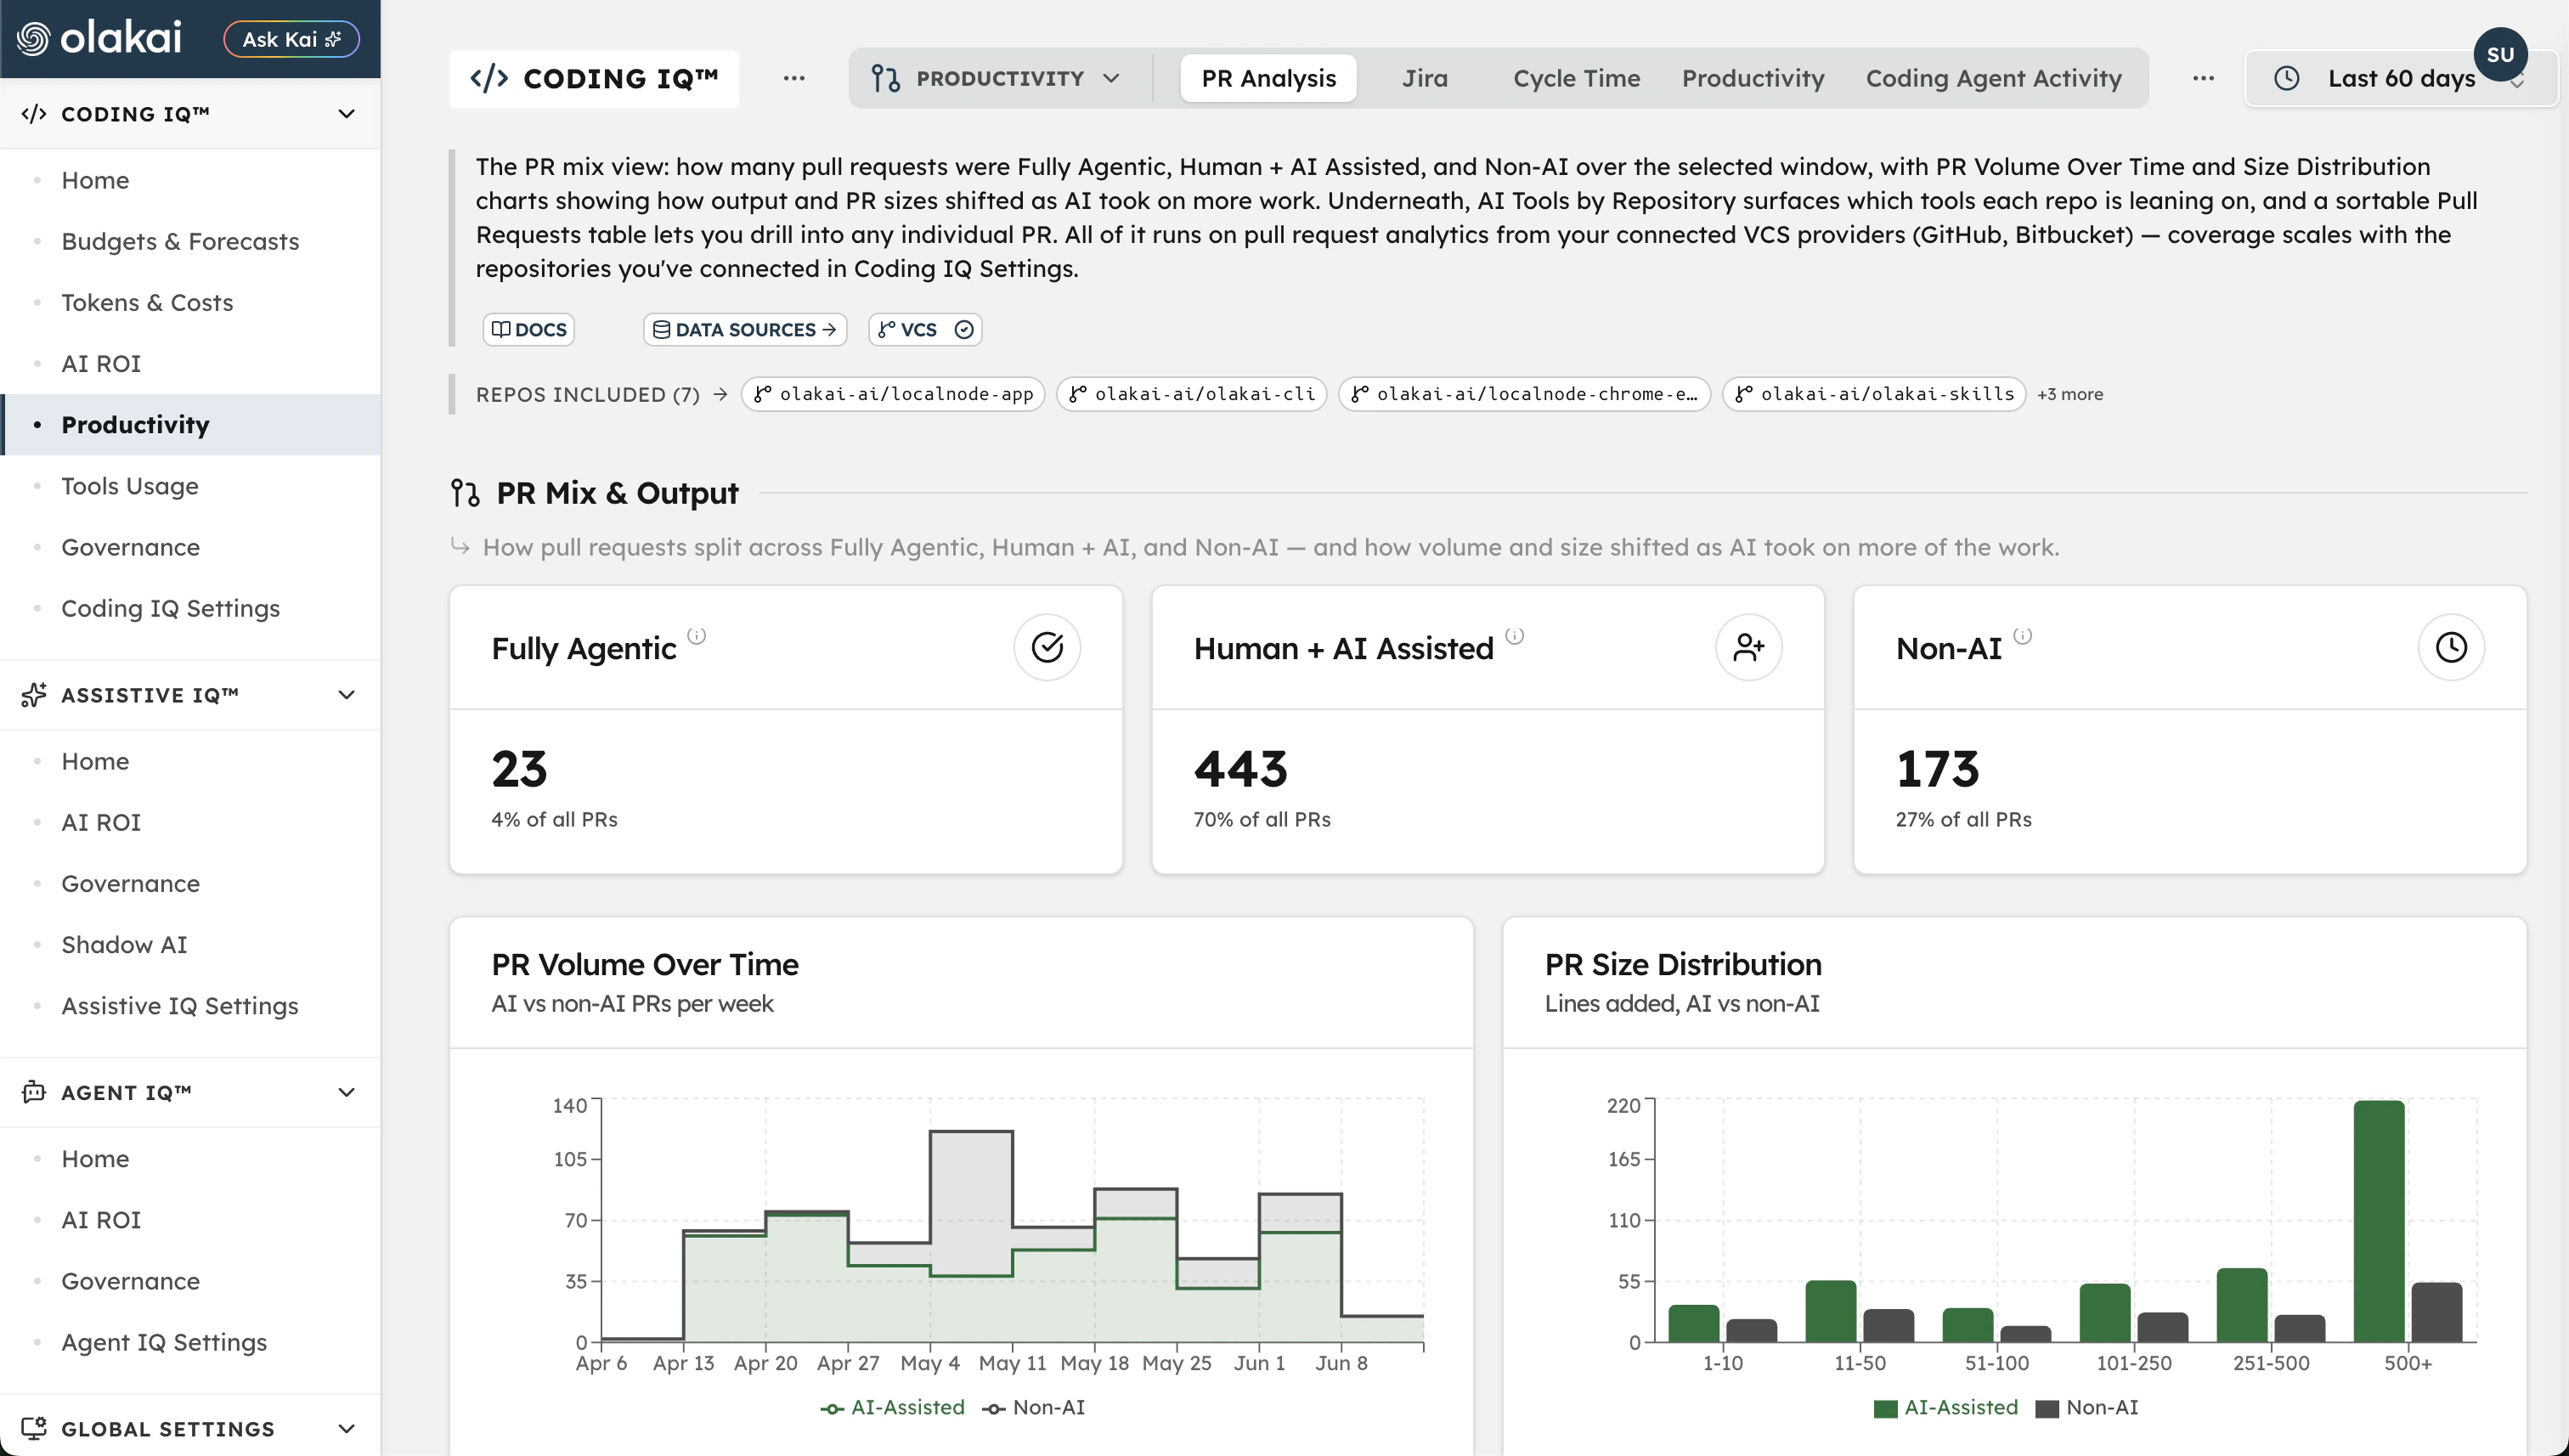
See exactly how much faster AI-assisted PRs ship
Coding IQ ingests PR data directly from your GitHub organization, no agent or SDK required. Every PR is automatically classified as AI-assisted or non-AI by reading commit co-author trailers, bot authorship, and PR body markers. The delta against your historical cycle time is unambiguous.
- Coding time, review time, and total cycle time — AI vs non-AI
- PR volume and size distribution over time
- AI code ratio: % of merged lines that came from AI-assisted PRs
Developers
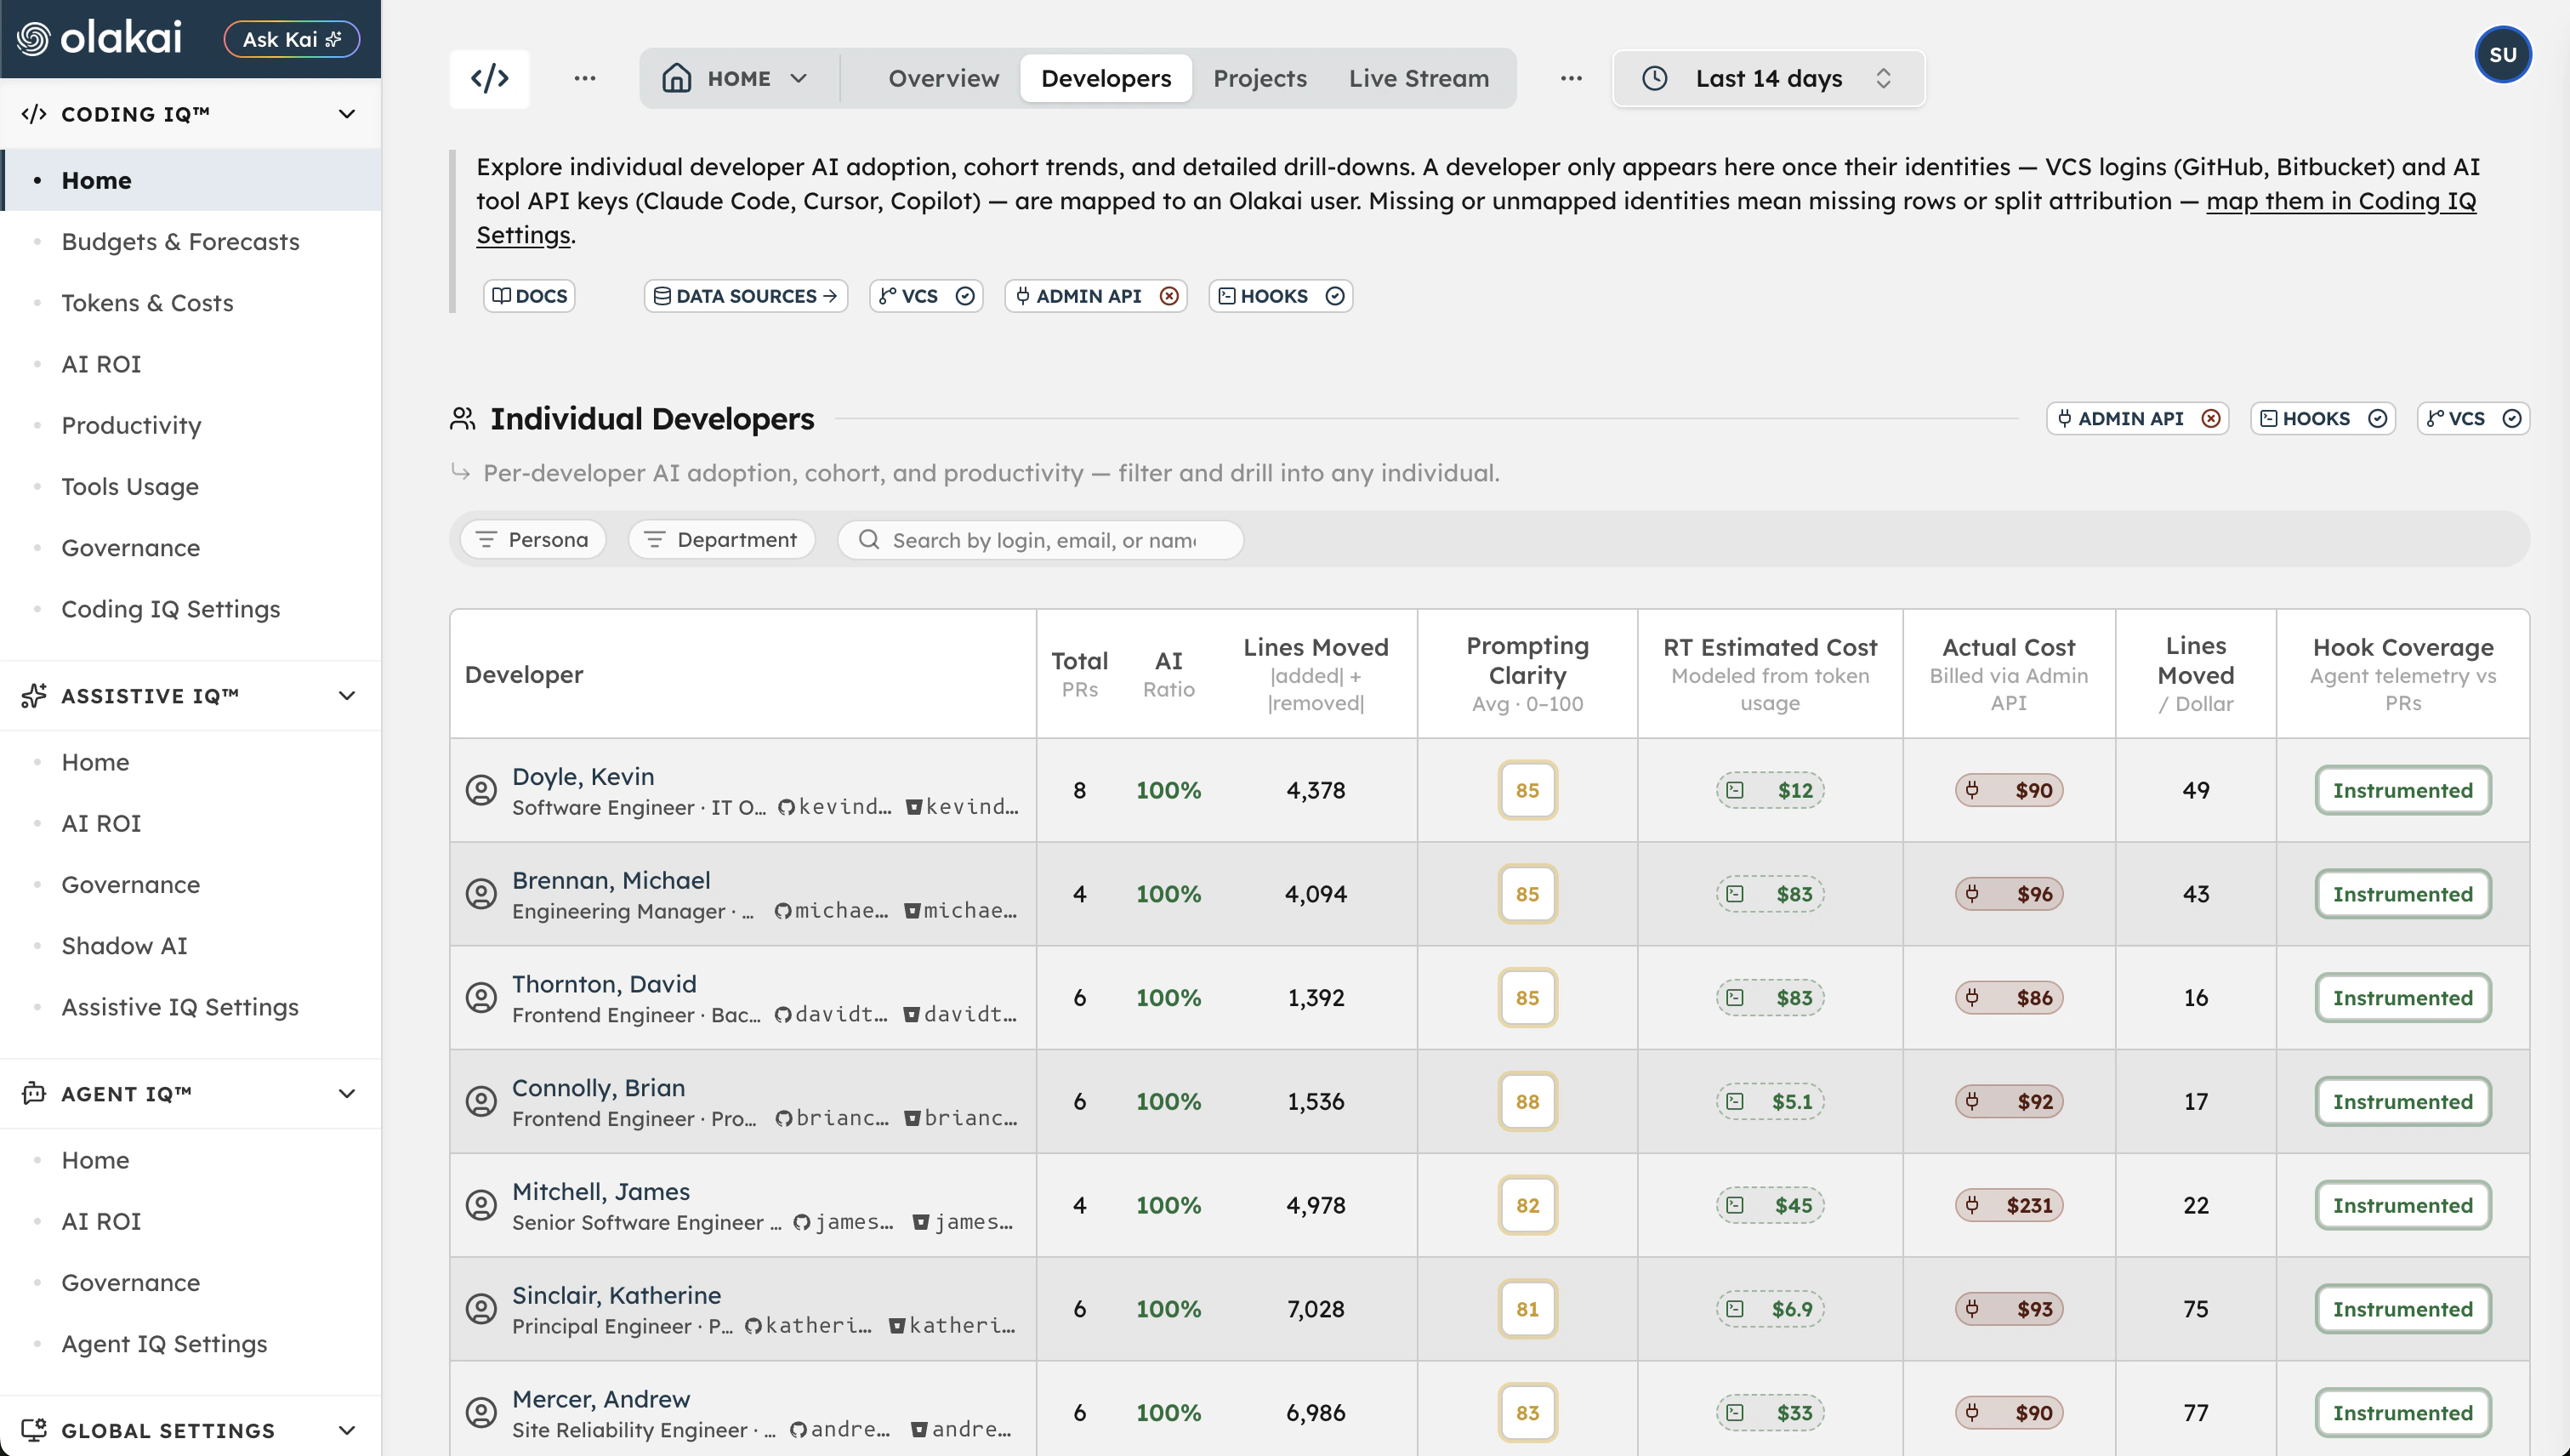
Find the idle licenses. Coach the casual users. Reward the power users.
Coding IQ segments every developer in your org into one of four adoption cohorts and shows you which tools they actually use, how often, and what their cycle time looks like compared to peers.
It also attributes spend to each developer – estimated and reconciled actual cost side by side – so who’s using what, and what it’s costing, is one table, not a month-end reconciliation project. The result: a precise list of who to enable, who to train, and where to reclaim spend.
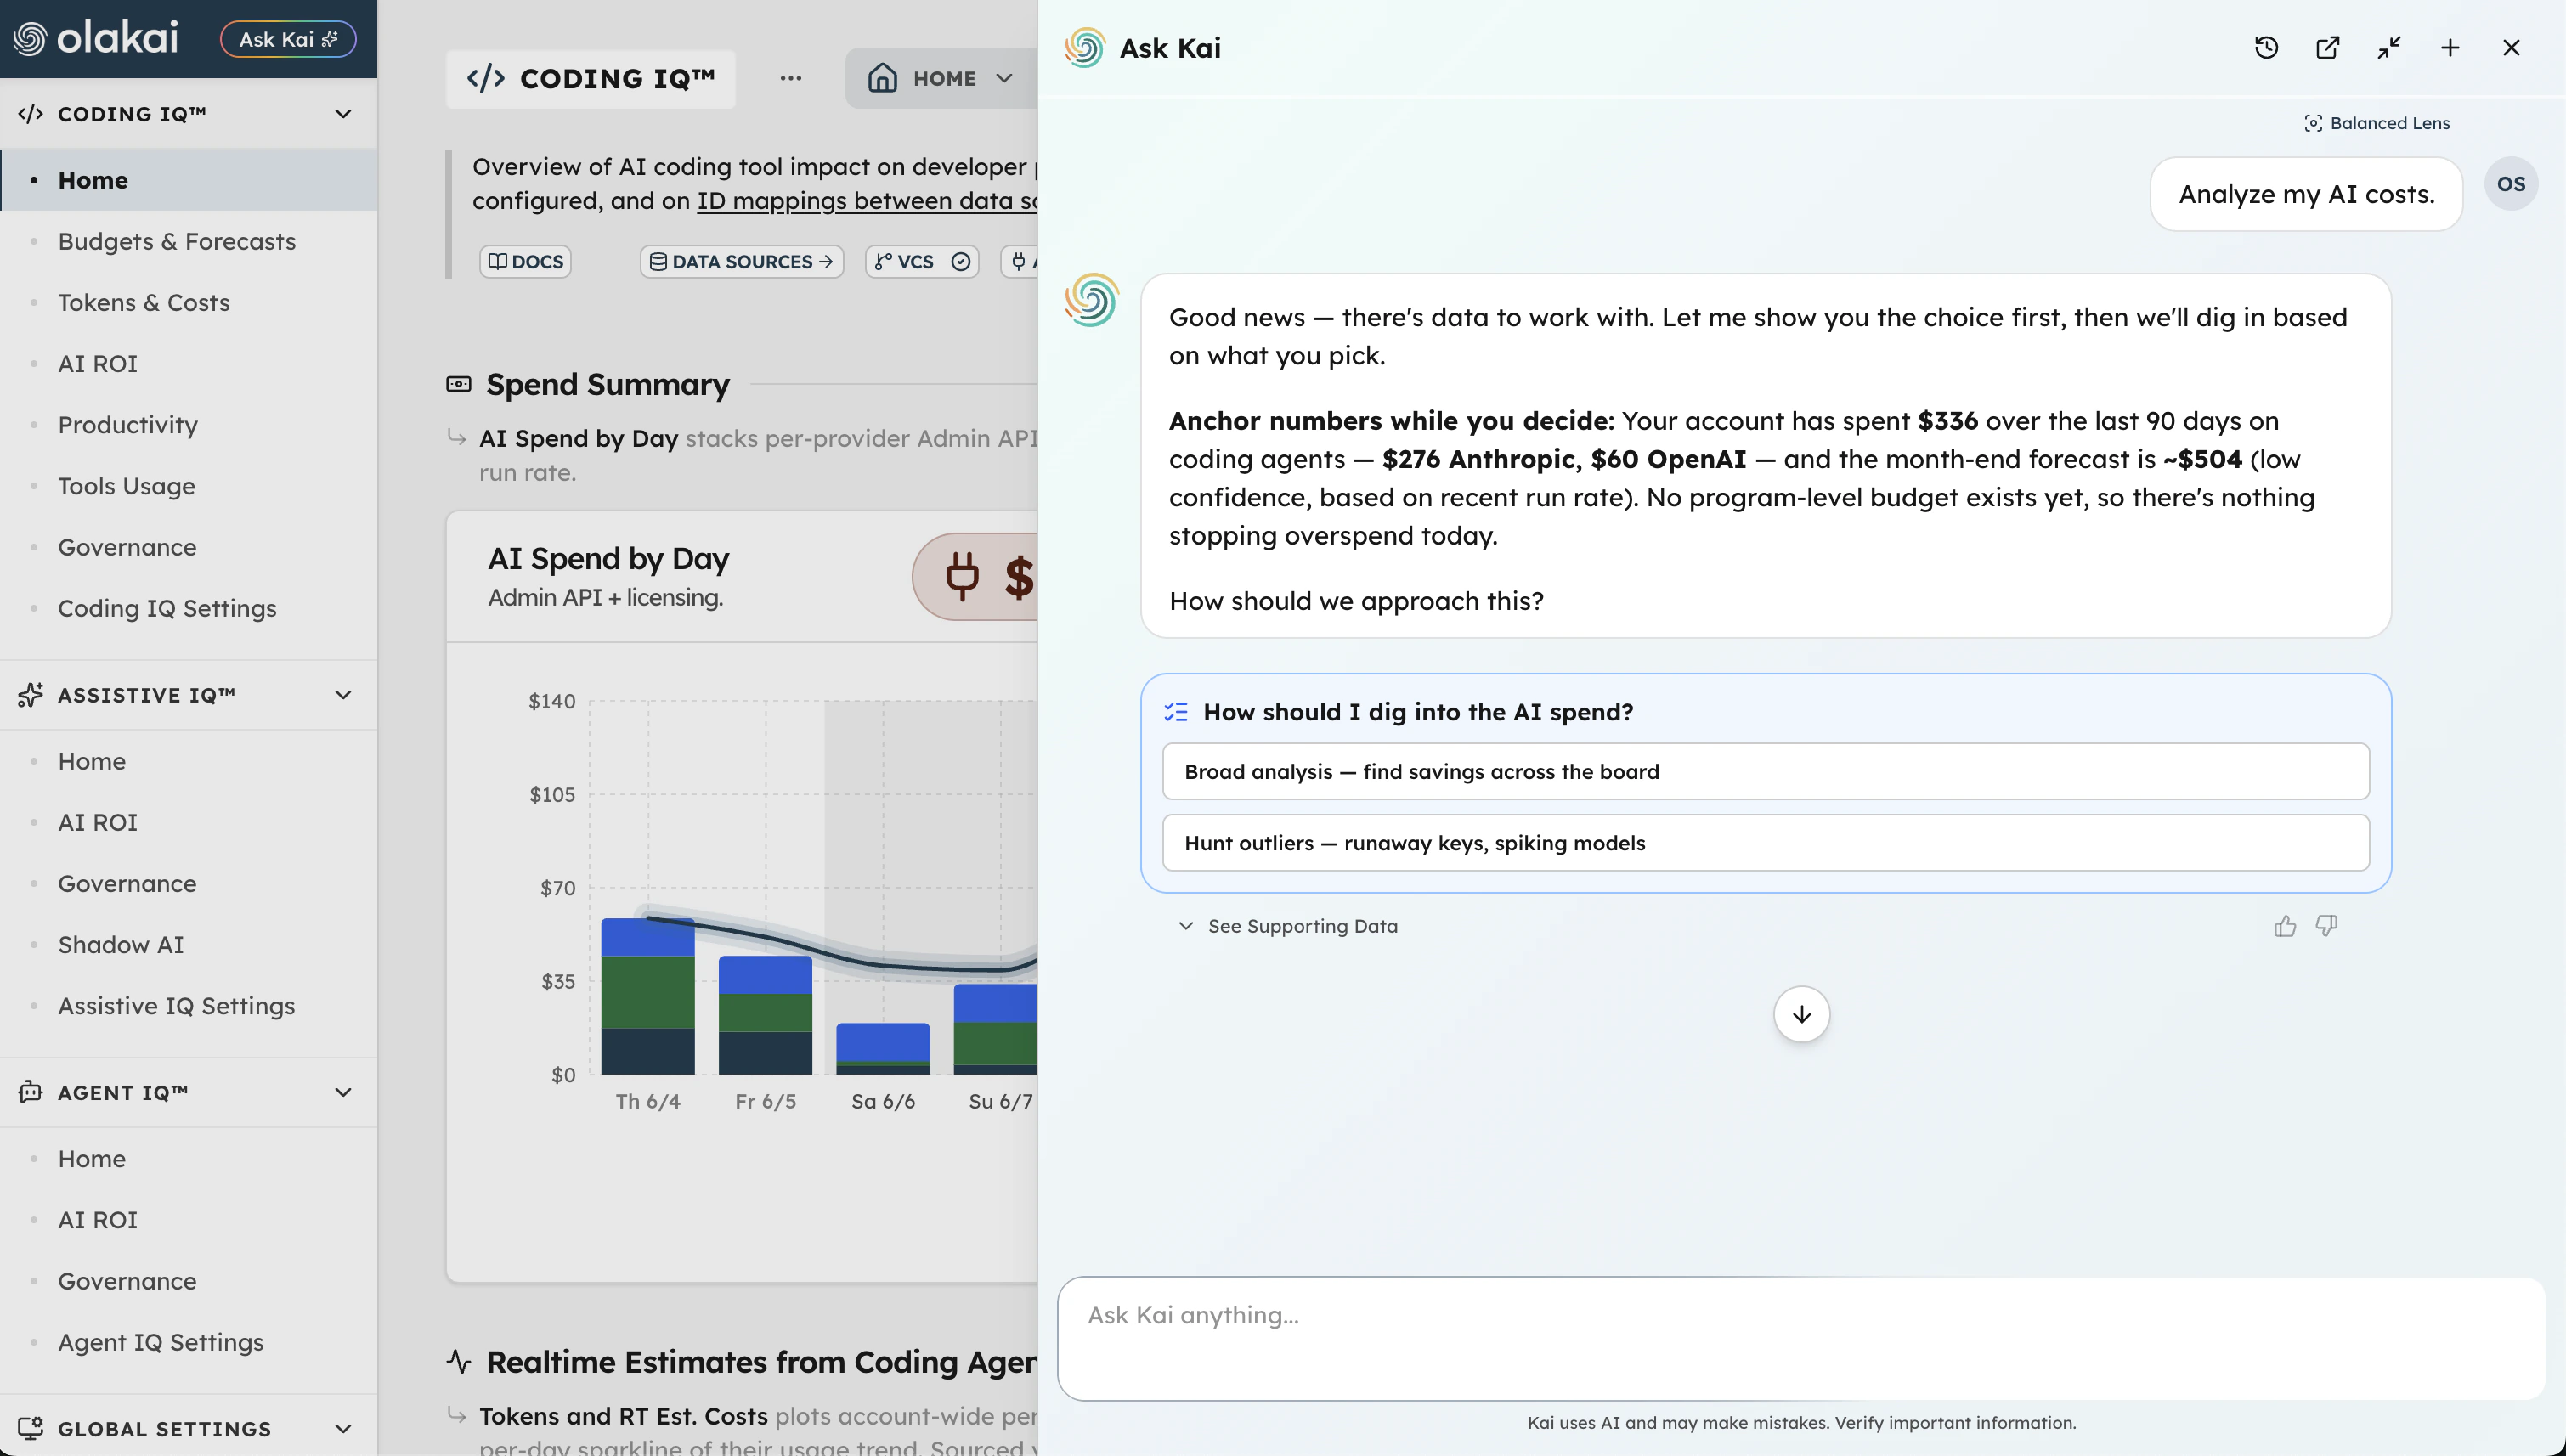
Ask Kai
Ask Kai where to cut, and how much you’ll save.
Ask Kai in plain English, and it reasons across spend by provider, model, developer, and project, then surfaces the specific moves: idle licenses to reclaim, expensive models to swap for cheaper ones, budgets to set before the next overrun. Every answer shows its reasoning and the dollar impact.
- “Which models are driving our spend, and where can we drop to a cheaper one?”
- “Which seats and licenses are going unused this month?”
- “Set a budget for the platform team and alert me before we hit 80%.”
More than measurement
AI ROI in dollars
Coding IQ translates productivity gains into business impact with AI Equivalent Engineers — a dollar-value read on how much engineering capacity your AI tooling is adding, using a per-developer before-and-after method over fixed calendar windows. It’s the number that turns “AI made us faster” into a figure you can take to the board.
Governance, scoped to code
Coding IQ watches coding-agent traffic for PII, PHI, and secrets, with its own risk surface kept separate from Agent IQ so the two never double-count. Velocity and spend visibility never come at the expense of knowing what’s leaking into prompts.
Coding IQ doesn’t live in a silo.
It runs on the same platform as Agent IQ and Assistive IQ, so the engineering velocity and spend story rolls up into the same enterprise AI ROI dashboard your CFO and CAIO are already looking at. And because everything flows through Kai, you can ask your AI program a question in plain English and get a reasoned answer in seconds:
“Are we forecast to overrun any coding budget this month, and which team is driving it?”
See your spend. Kill the waste. Maximize your AI ROI.
We provide this. With clear evidence.
See your number, not a sandbox. A short working session on your real spend, tailored to your stack. No deck, no pitch.