Category: AI Strategy

Strategic guidance for enterprise AI adoption and measurement

  • Your AI Coding Tools Are Generating Code. Are They Generating Value?

    Your AI Coding Tools Are Generating Code. Are They Generating Value?

    Your engineering team just shipped 10,000 lines of code this sprint. Nearly half of it was written by AI. Do you know which half — and whether it was any good?

    This isn’t a theoretical question anymore. According to the 2025 DORA Report, almost half of companies now have at least 50% AI-generated code, up from just 20% at the start of 2025. Ninety percent of engineering teams now use AI coding tools in their workflows. Cursor crossed $2 billion in annualized revenue by February 2026. Claude Code hit $2.5 billion. GitHub Copilot remains embedded in enterprises worldwide. The adoption question is settled.

    The measurement question is not.

    The Measurement Gap Nobody Talks About

    Here’s what most engineering leaders are tracking: lines of code generated, completion acceptance rates, developer satisfaction surveys, and seat utilization. These are vanity metrics. They tell you that developers are using the tools. They don’t tell you whether the tools are making your organization better.

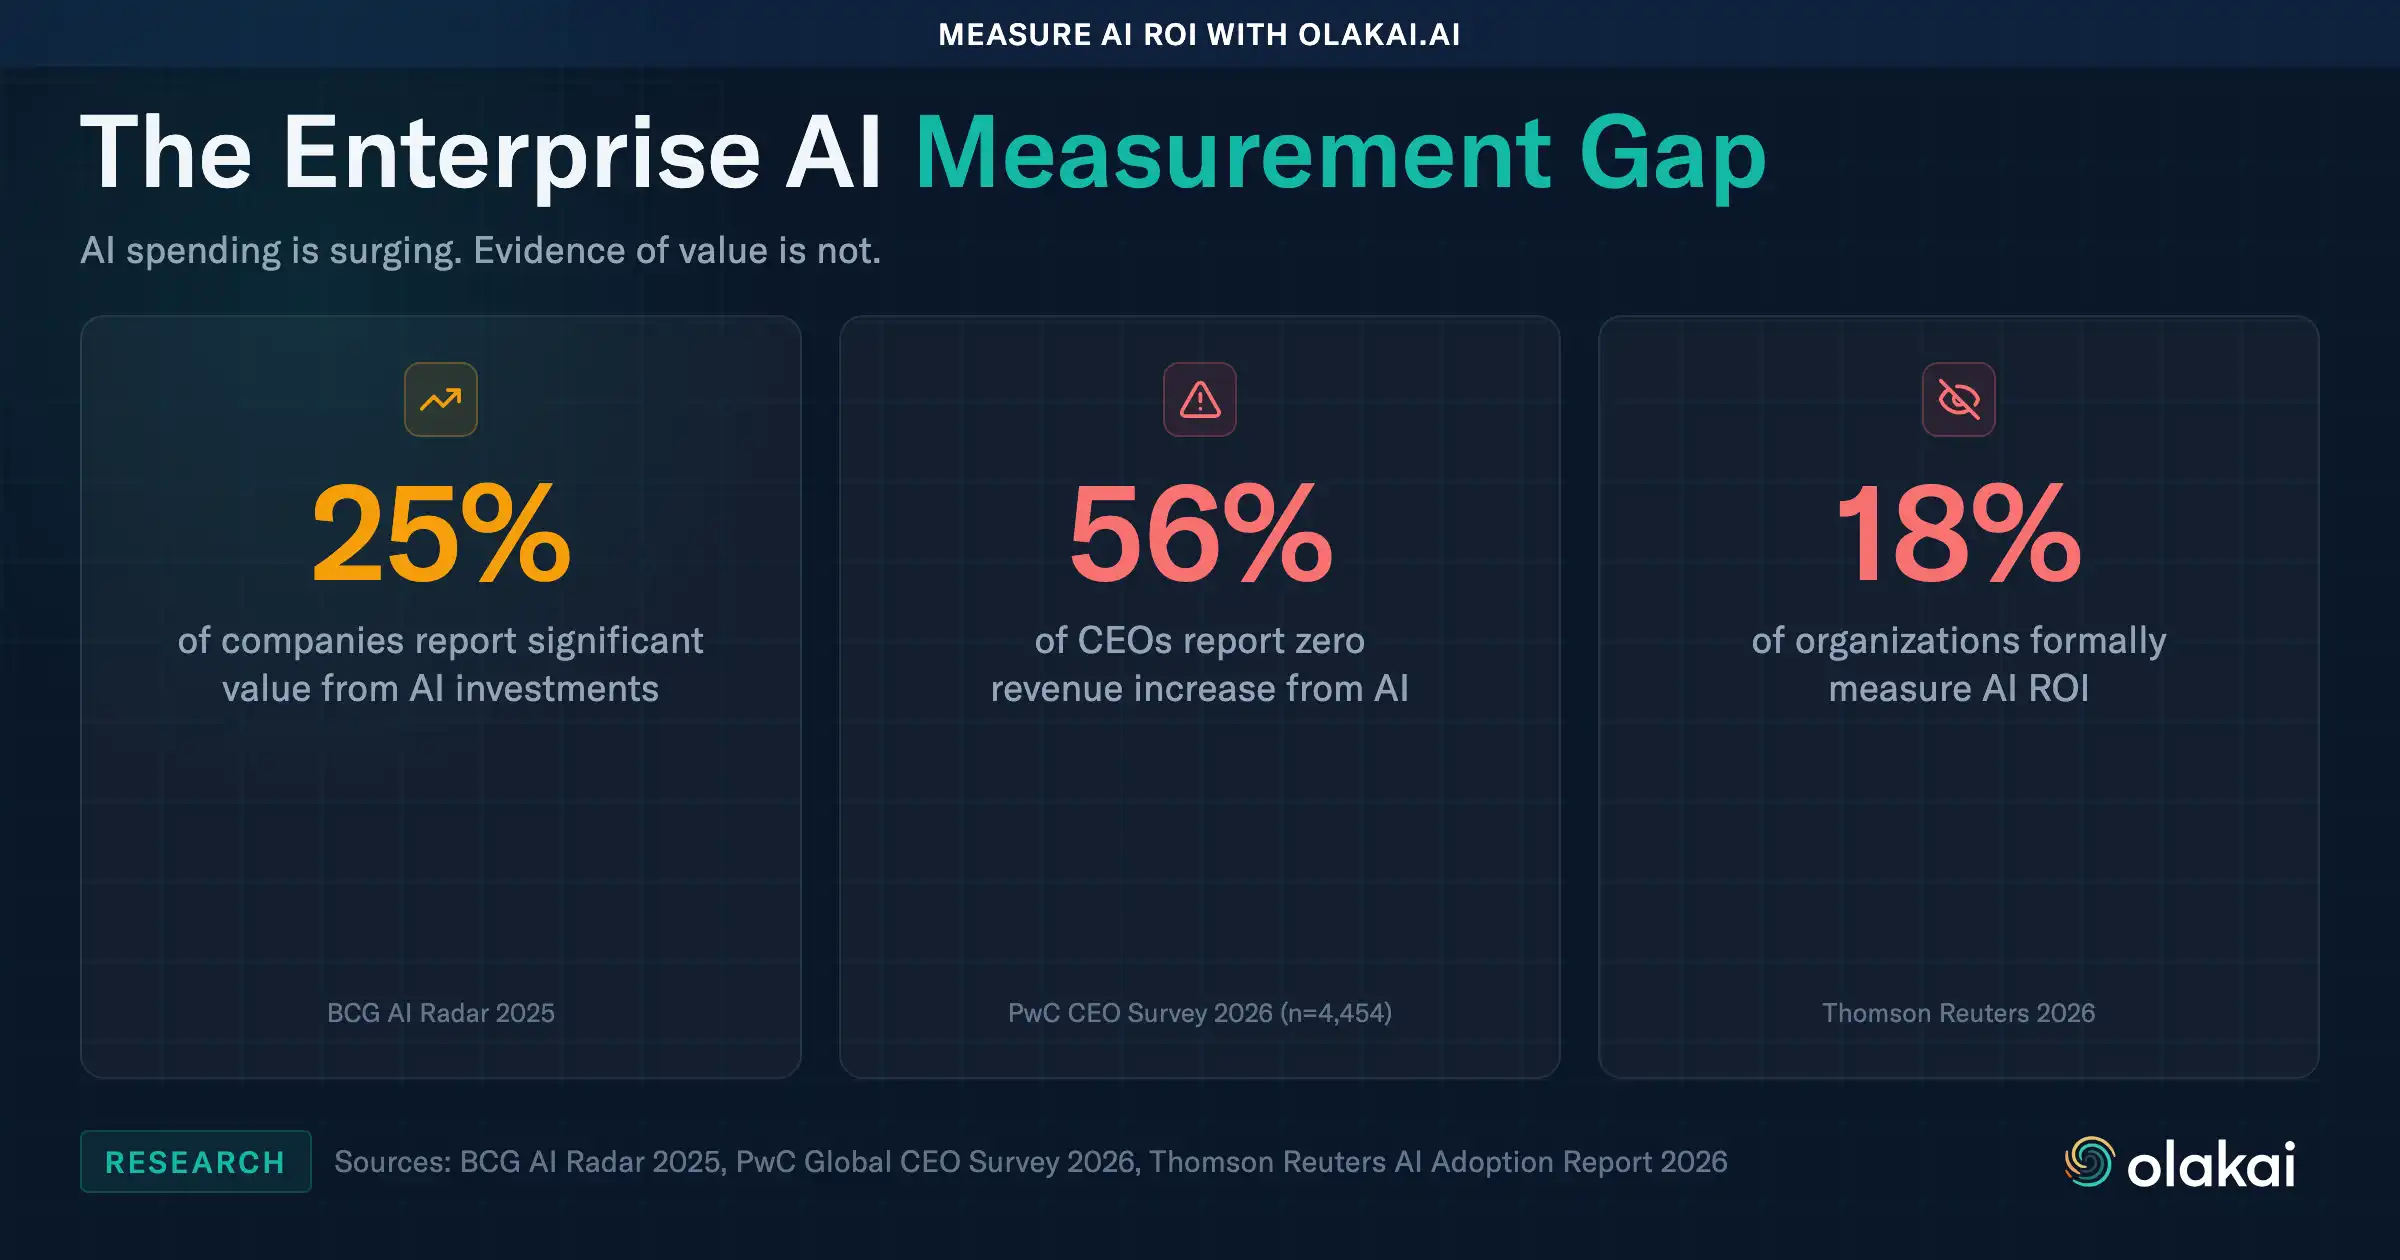
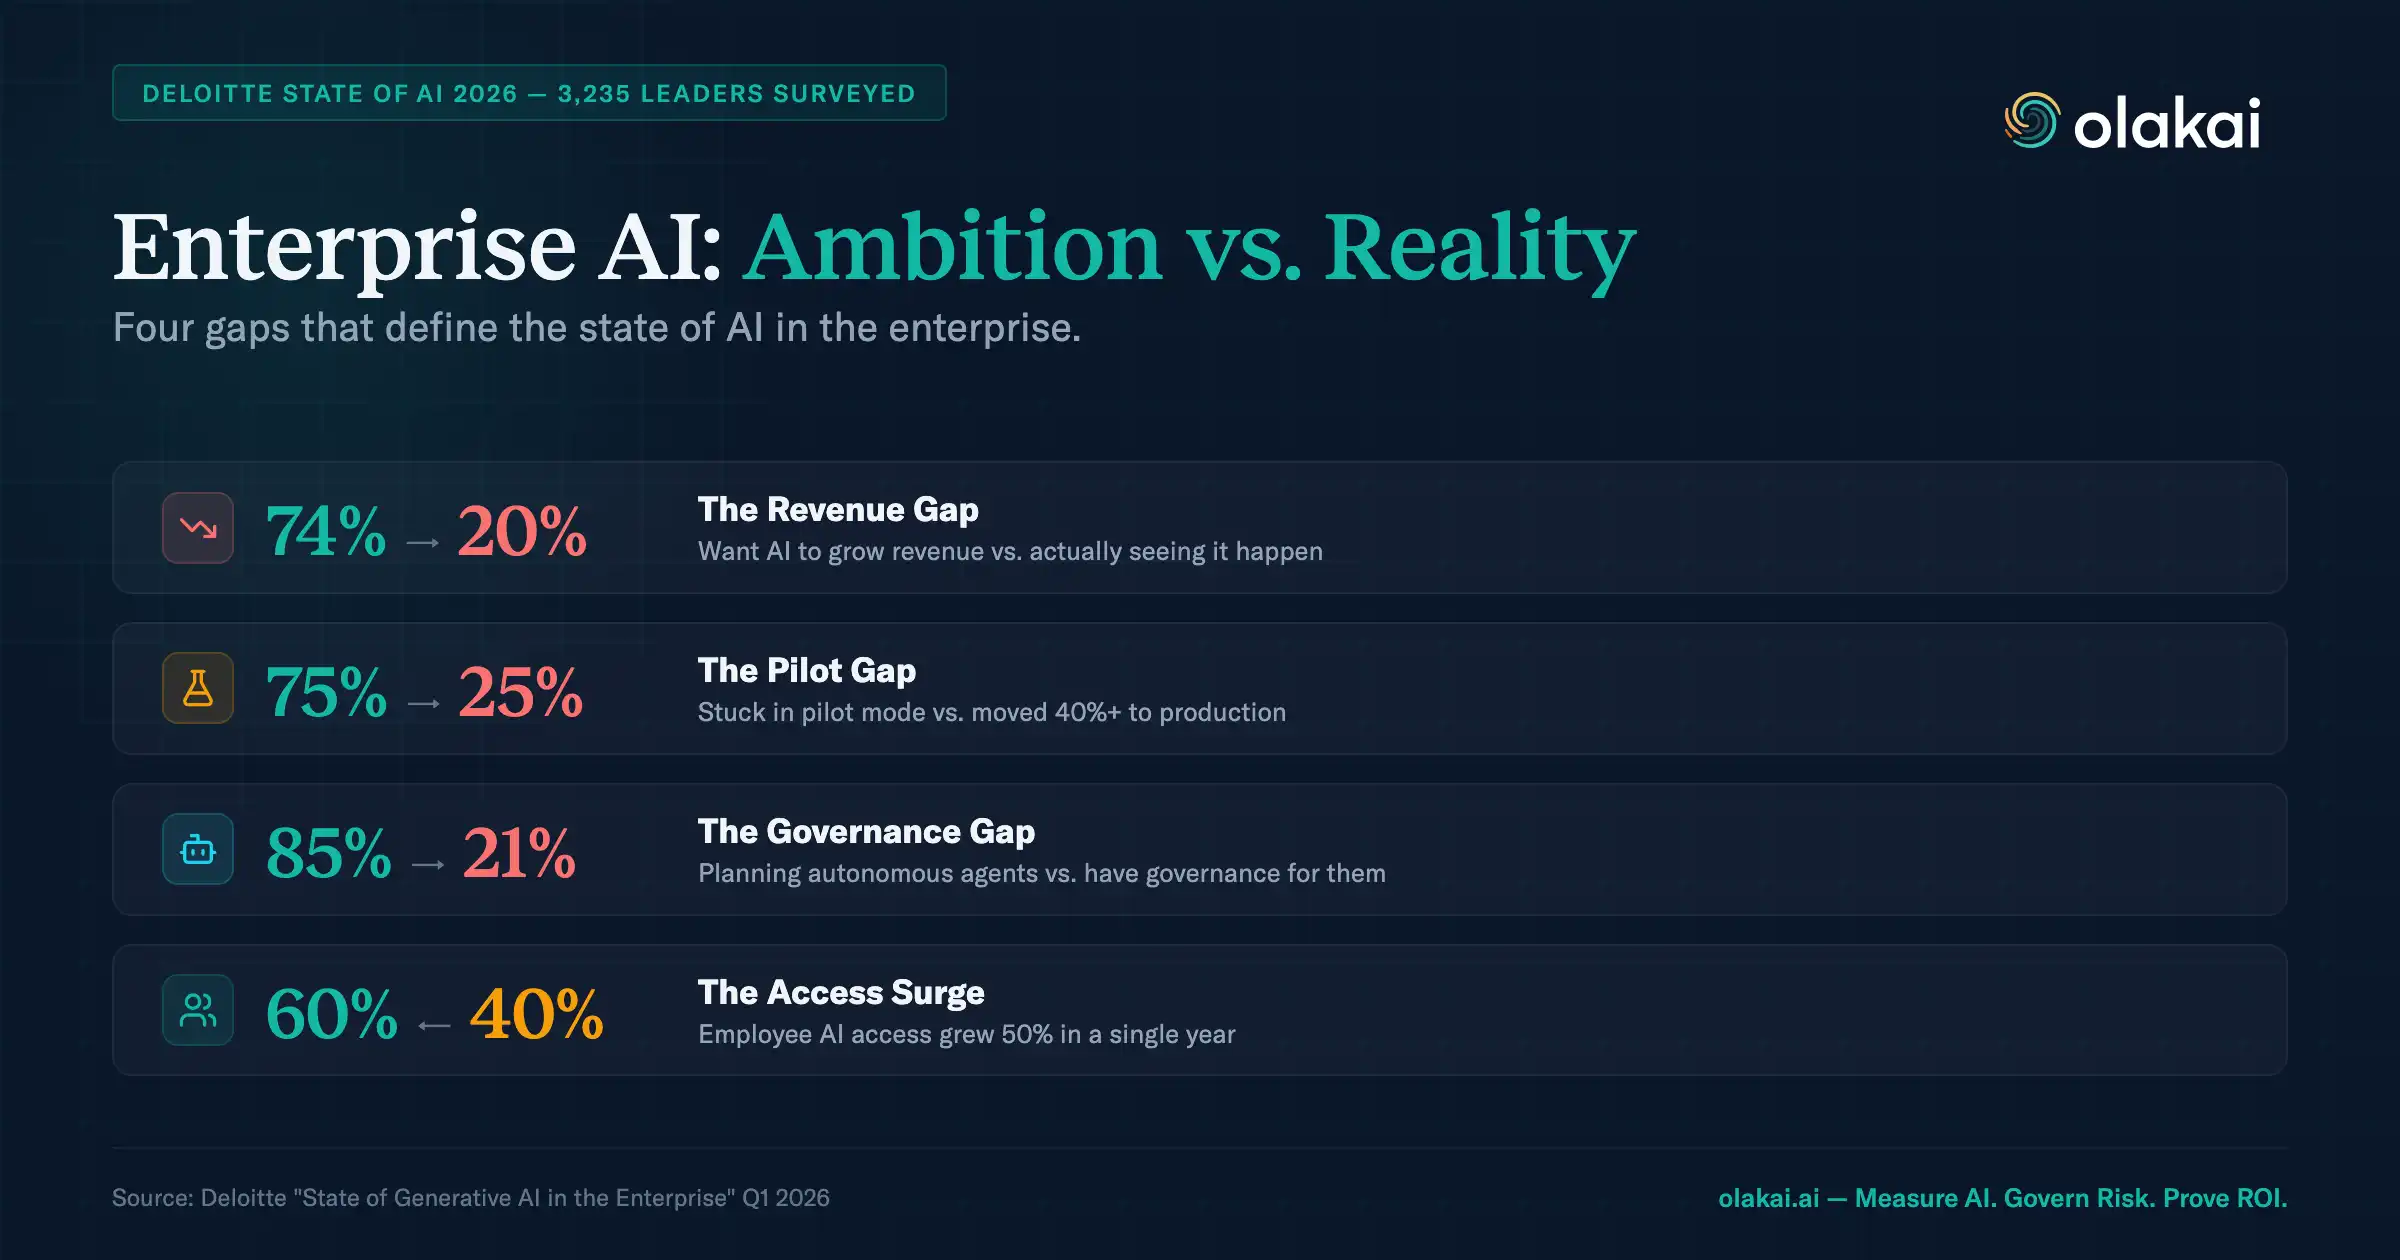
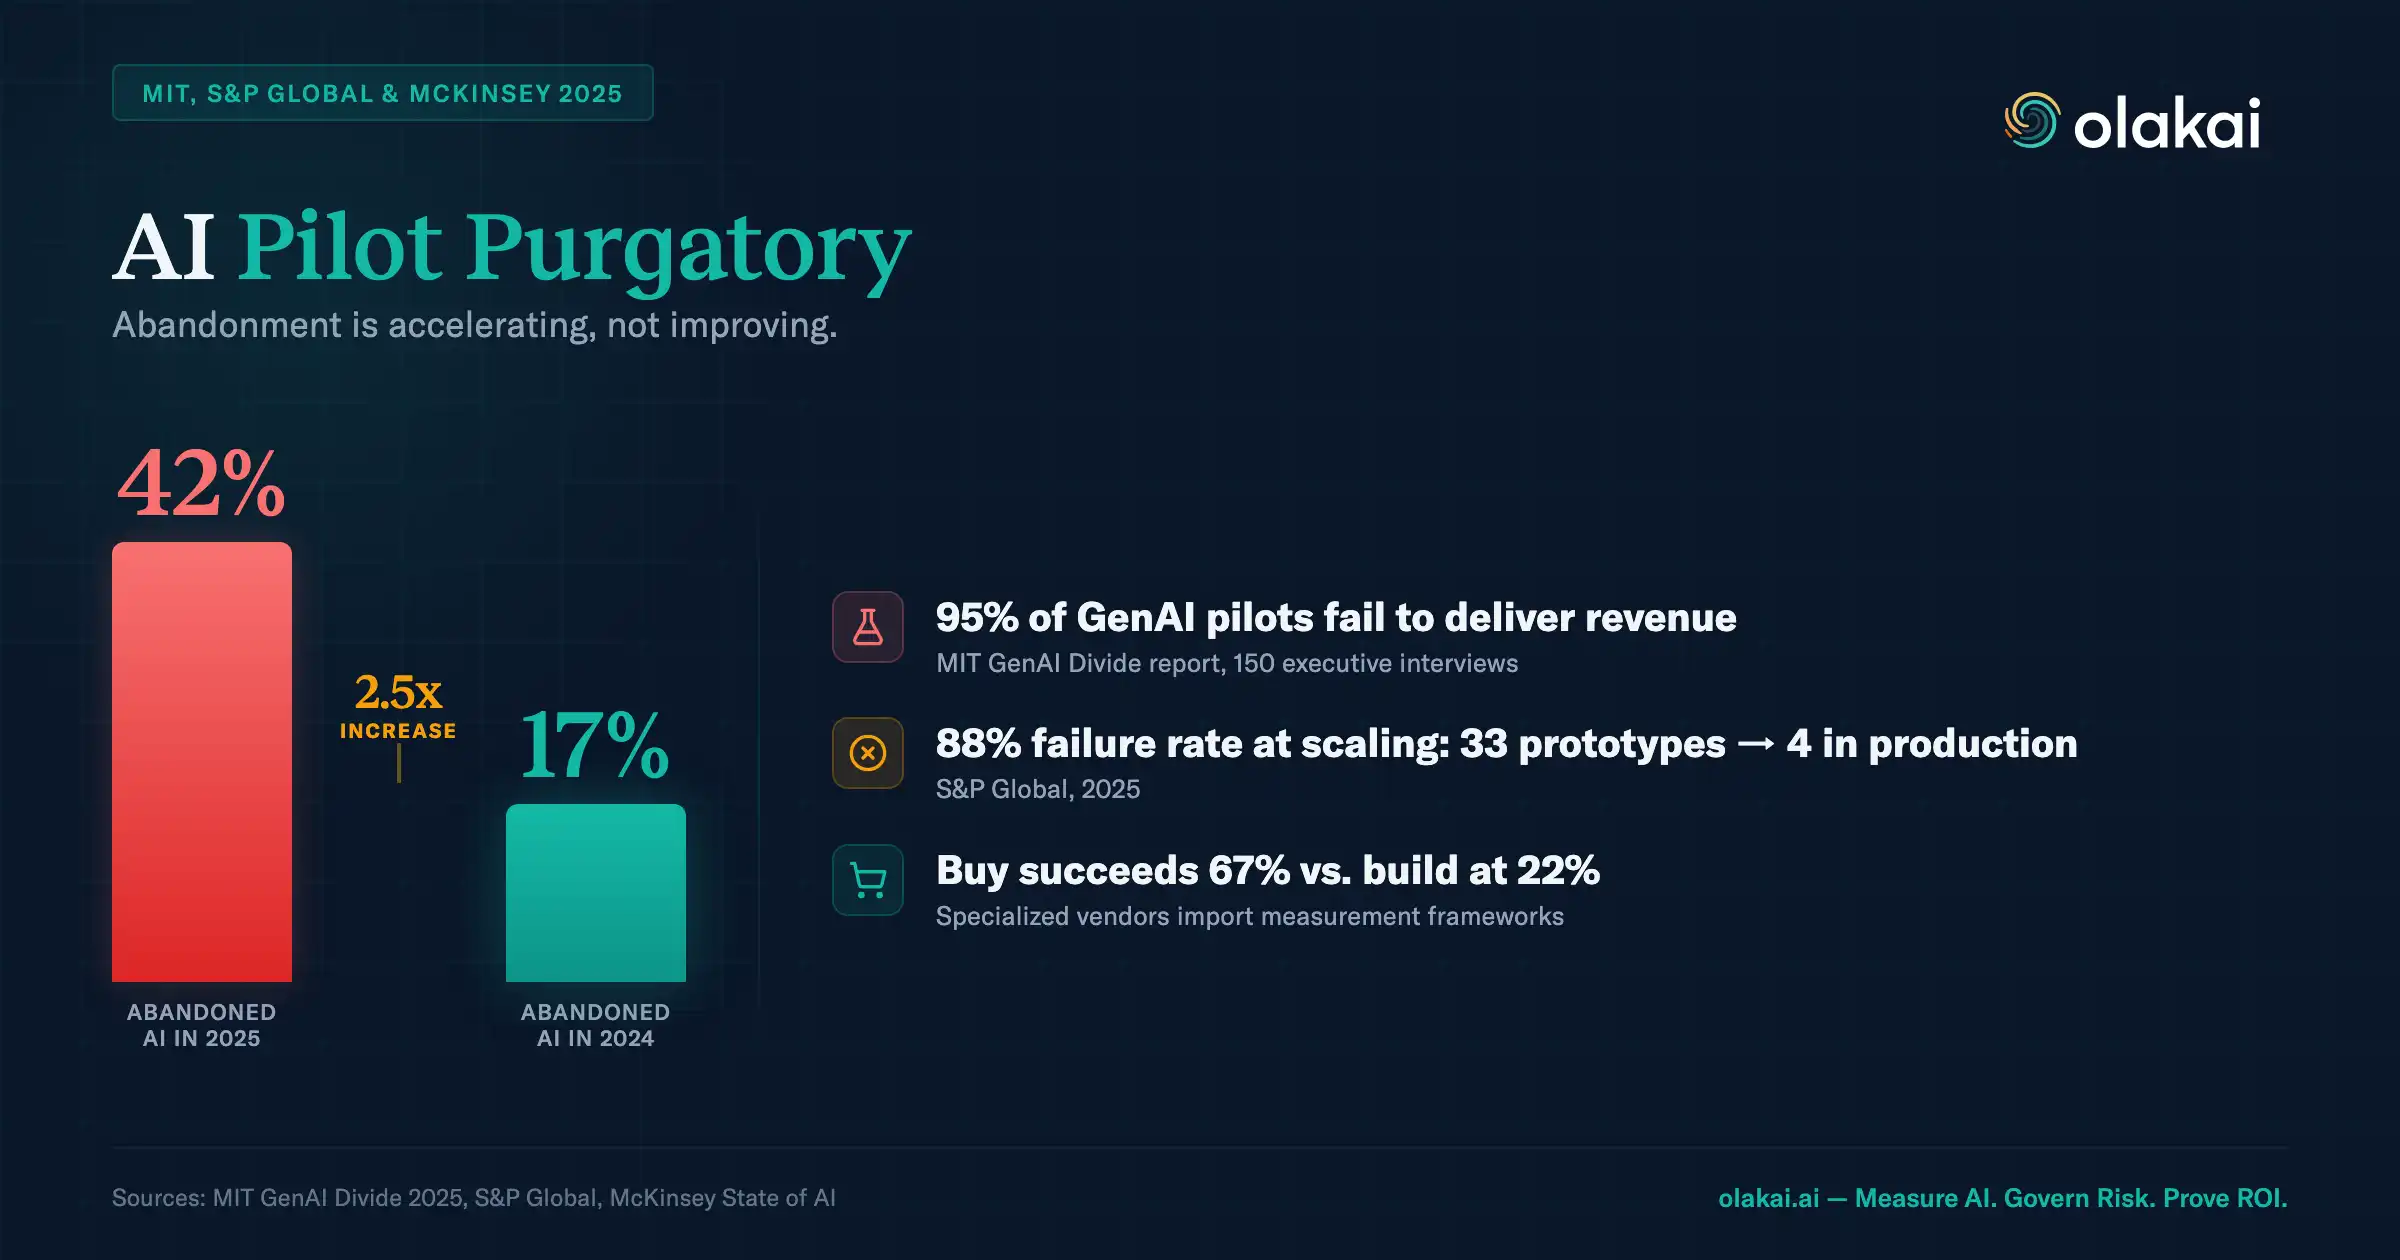
    BCG found that 60% of companies have no defined financial KPIs for their AI initiatives — they’re counting pilots, celebrating deployments, and measuring model accuracy instead of actual business value. Bain’s 2025 Technology Report went further, finding that AI coding tools deliver only 10 to 15 percent productivity gains despite adoption by two-thirds of software firms. That’s a fraction of the 10x improvement vendors promised.

    The gap between what companies measure and what actually matters is where millions disappear. Your board isn’t asking how many code completions your team accepted last quarter. They’re asking whether your $1.2 million in AI coding tool licenses is making your engineering organization faster, safer, and more competitive. If you can’t answer that question with data, you have a measurement problem — not a productivity problem.

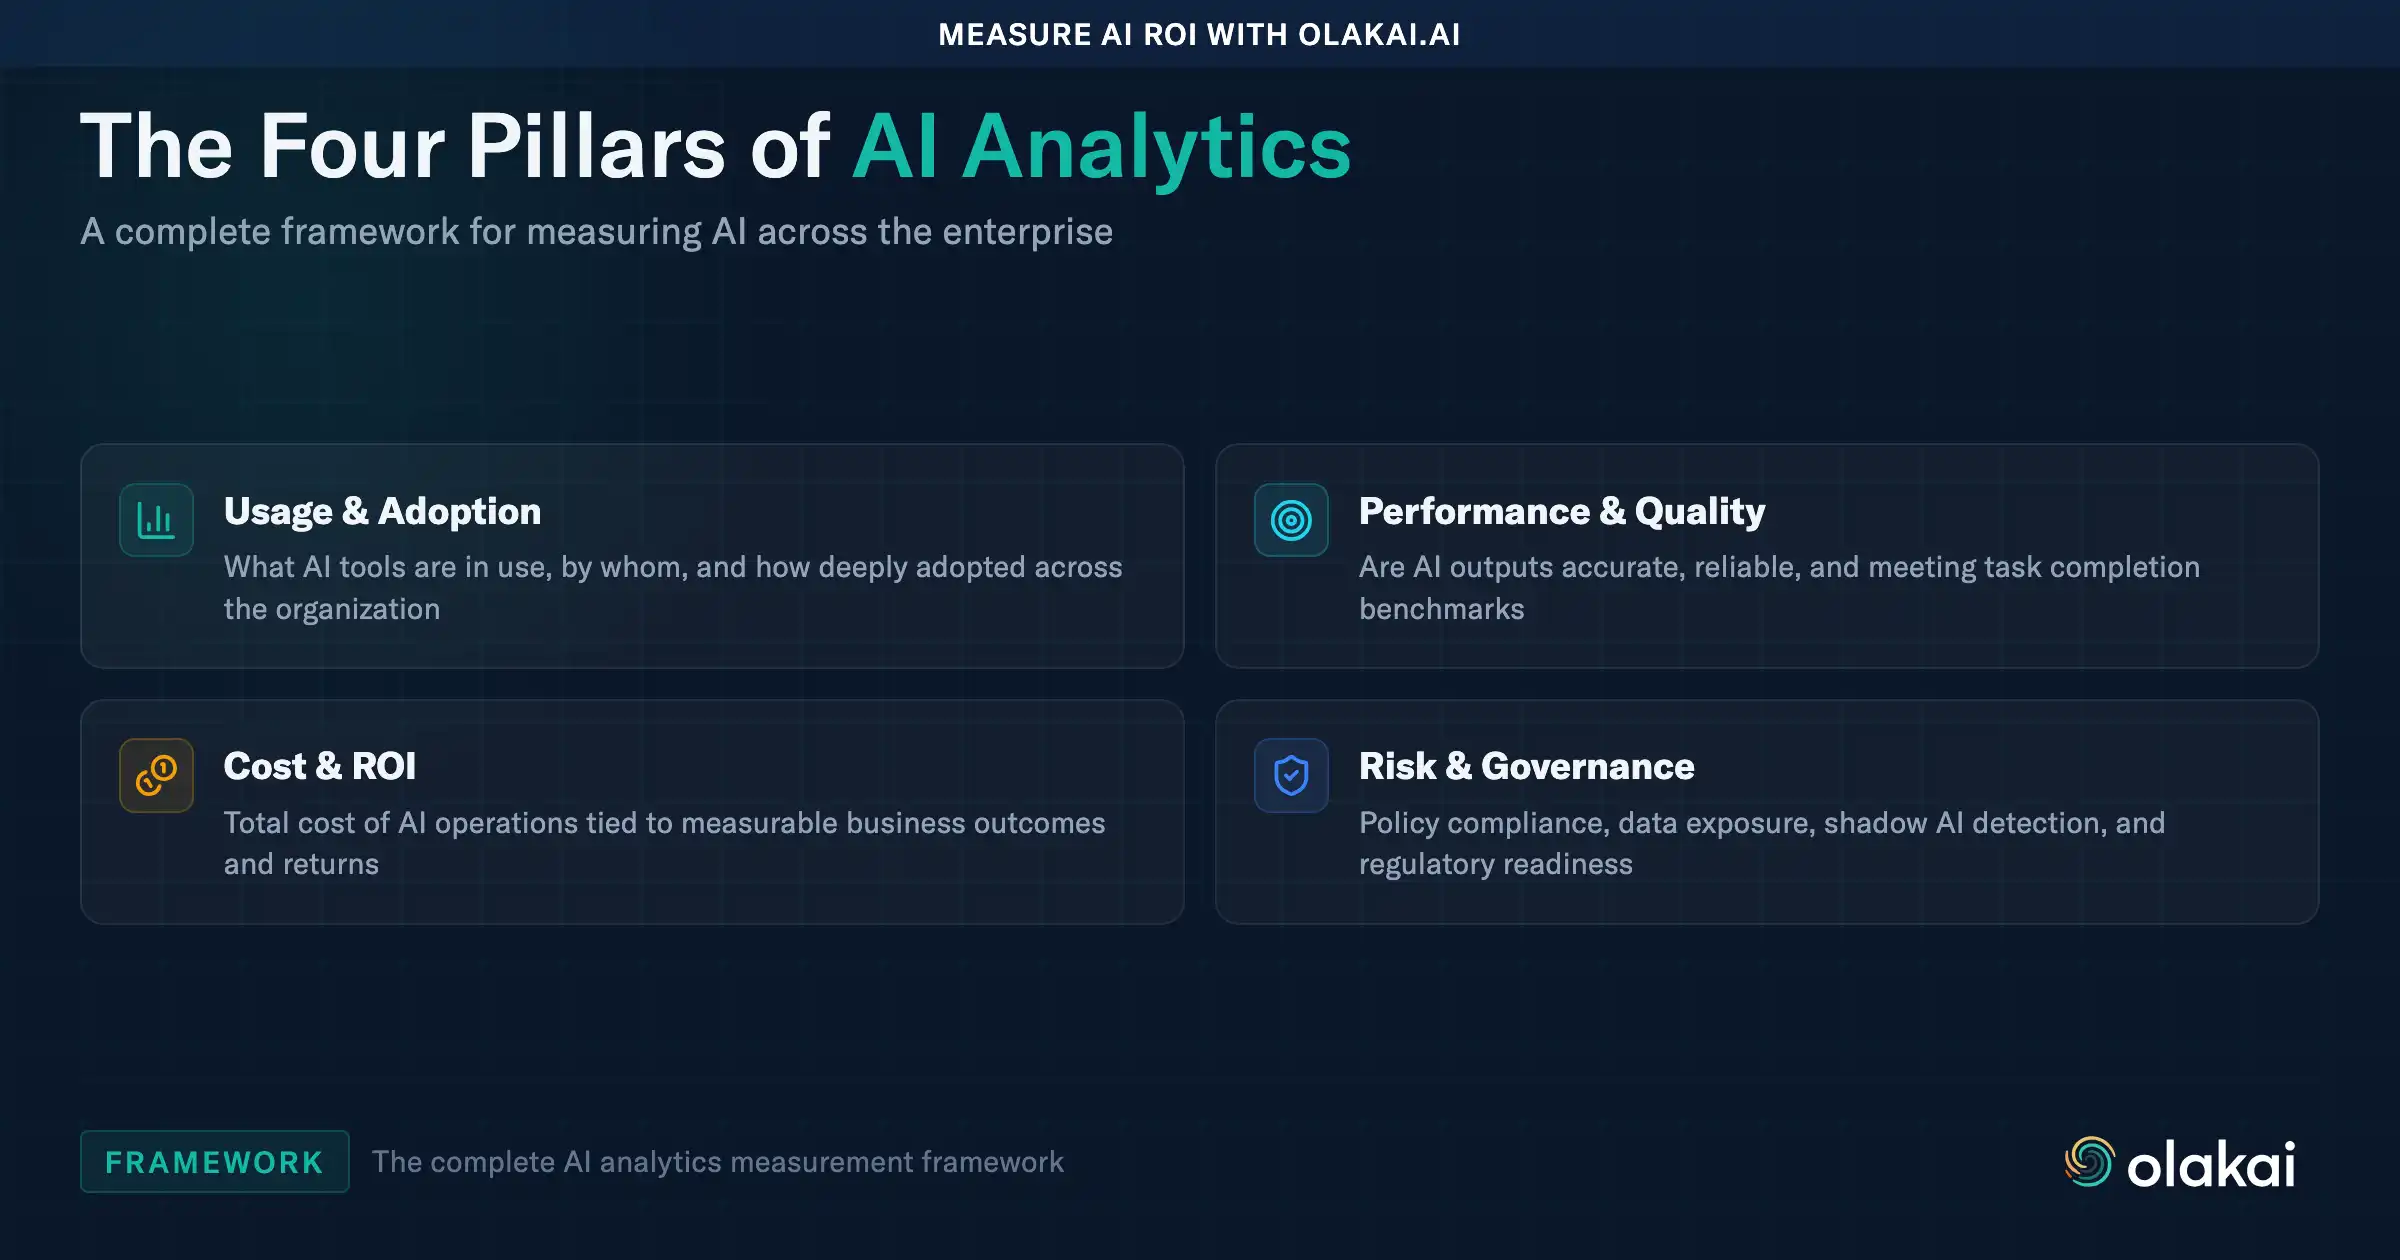
    What You Should Be Measuring Instead

    The metrics that matter for AI coding tools aren’t about the tools themselves. They’re about what happens after the code ships.

    Cycle time delta. How much faster do AI-assisted pull requests move from first commit to production compared to non-AI pull requests? This is the clearest signal of real productivity gain. Early data suggests AI-assisted PRs are 25 to 40 percent faster through the pipeline, but this varies wildly by team, codebase complexity, and tool. If you aren’t measuring the delta, you’re guessing.

    Incident rate on AI-authored code. A Stanford study cited by CIO.com found that participants using coding assistants wrote less secure code in 80% of tasks — yet were 3.5 times more likely to believe their code was secure. That confidence gap is dangerous. If your AI-generated code is creating more production incidents, more security vulnerabilities, or more hotfixes, the productivity gains are illusory. You need to track post-deployment quality by code origin.

    Cost per pull request by provider. Your team is probably using three or four AI coding tools simultaneously — Copilot on some repos, Cursor on others, Claude Code for complex refactors. Each has different pricing, different token consumption patterns, and different value profiles. Without a unified cost-per-PR metric across providers, you can’t make rational decisions about which tools to standardize and which licenses are going unused.

    Deployment frequency. The DORA framework remains the gold standard for engineering performance, but AI introduces a wrinkle. Deployment frequency may rise slightly while lead times increase as review cycles grow longer to accommodate AI-generated code. Measuring deployment frequency in isolation misses this dynamic. You need to track it alongside review time and change failure rate to see the full picture.

    The Shadow Coding Problem

    There’s another dimension most CTOs haven’t confronted: developers using personal accounts for AI coding tools that your organization doesn’t manage, monitor, or govern.

    A developer signs up for Cursor with a personal email. Another uses Claude Code through a personal API key. A third is running a locally hosted model for code generation. None of these show up in your IT asset inventory. None are covered by your data handling policies. And all of them are processing your proprietary source code through systems you don’t control.

    This is shadow AI in the codebase — and it’s arguably more dangerous than shadow AI in other parts of the organization because the outputs become permanent parts of your software. Code generated through ungoverned tools gets committed, reviewed, merged, and deployed. It becomes your product. If that code was generated using a model that trained on GPL-licensed code, or if proprietary algorithms were sent to a third-party API without appropriate data handling agreements, the liability sits with your organization — not the developer.

    According to HiddenLayer’s 2026 AI Threat Landscape Report, 76% of organizations now cite shadow AI as a definite or probable problem, a 15-point jump from the prior year. For engineering organizations, the stakes are uniquely high because the shadow doesn’t just create risk — it becomes part of the product.

    The Adoption Cohort Blindspot

    Aggregate metrics hide critical patterns. When engineering leaders report that “our team has 70% AI adoption,” they’re averaging over a distribution that looks nothing like a uniform curve.

    In practice, adoption breaks into cohorts. Power users — developers with more than 70% of their pull requests AI-assisted — are producing dramatically different work than casual users at 20 to 40 percent. New adopters who started using AI tools within the past two weeks have different needs than idle users who tried a tool once and stopped. Each cohort requires different support, different training, and different expectations.

    Without cohort-level visibility, you can’t identify which developers are getting genuine value, which ones need enablement, and which expensive licenses are sitting unused. You also can’t detect the productivity paradox that multiple studies have now documented: developers predict a 24% speedup from AI tools but some studies have measured a 19% slowdown, while those same developers still report a 20% perceived improvement afterward. The gap between perception and measurement is real, and only cohort-level data can surface it.

    What the Competitors Miss

    Engineering analytics platforms like Jellyfish have built impressive capabilities for measuring developer productivity. They can track DORA metrics, analyze PR throughput, and benchmark teams against each other. But they were built before AI coding became the default mode of software development, and their architecture reflects that.

    Most engineering analytics tools work from metadata — commit timestamps, PR merge events, Jira ticket transitions. They can tell you that a developer merged 12 PRs this week. They can’t tell you which of those PRs were AI-assisted, what tool was used, how much it cost, or whether the AI-generated portions introduced quality issues. Without code-level detection that identifies AI co-author trailers, bot PR authors, and tool-specific markers, the attribution problem remains unsolvable.

    Then there’s the governance dimension. Your CISO needs to know which AI tools are processing your source code and whether they comply with your data handling policies. Your CFO needs to know the total cost across all AI coding providers, not just the ones IT provisioned. Your compliance team needs an audit trail showing what code was AI-generated and by which model. Productivity analytics tools don’t cover any of this.

    The measurement gap isn’t just about better dashboards. It’s about connecting AI ROI measurement with governance, cost control, and security in a single view — the same way organizations learned to manage cloud infrastructure by combining performance monitoring with cost optimization and compliance controls.

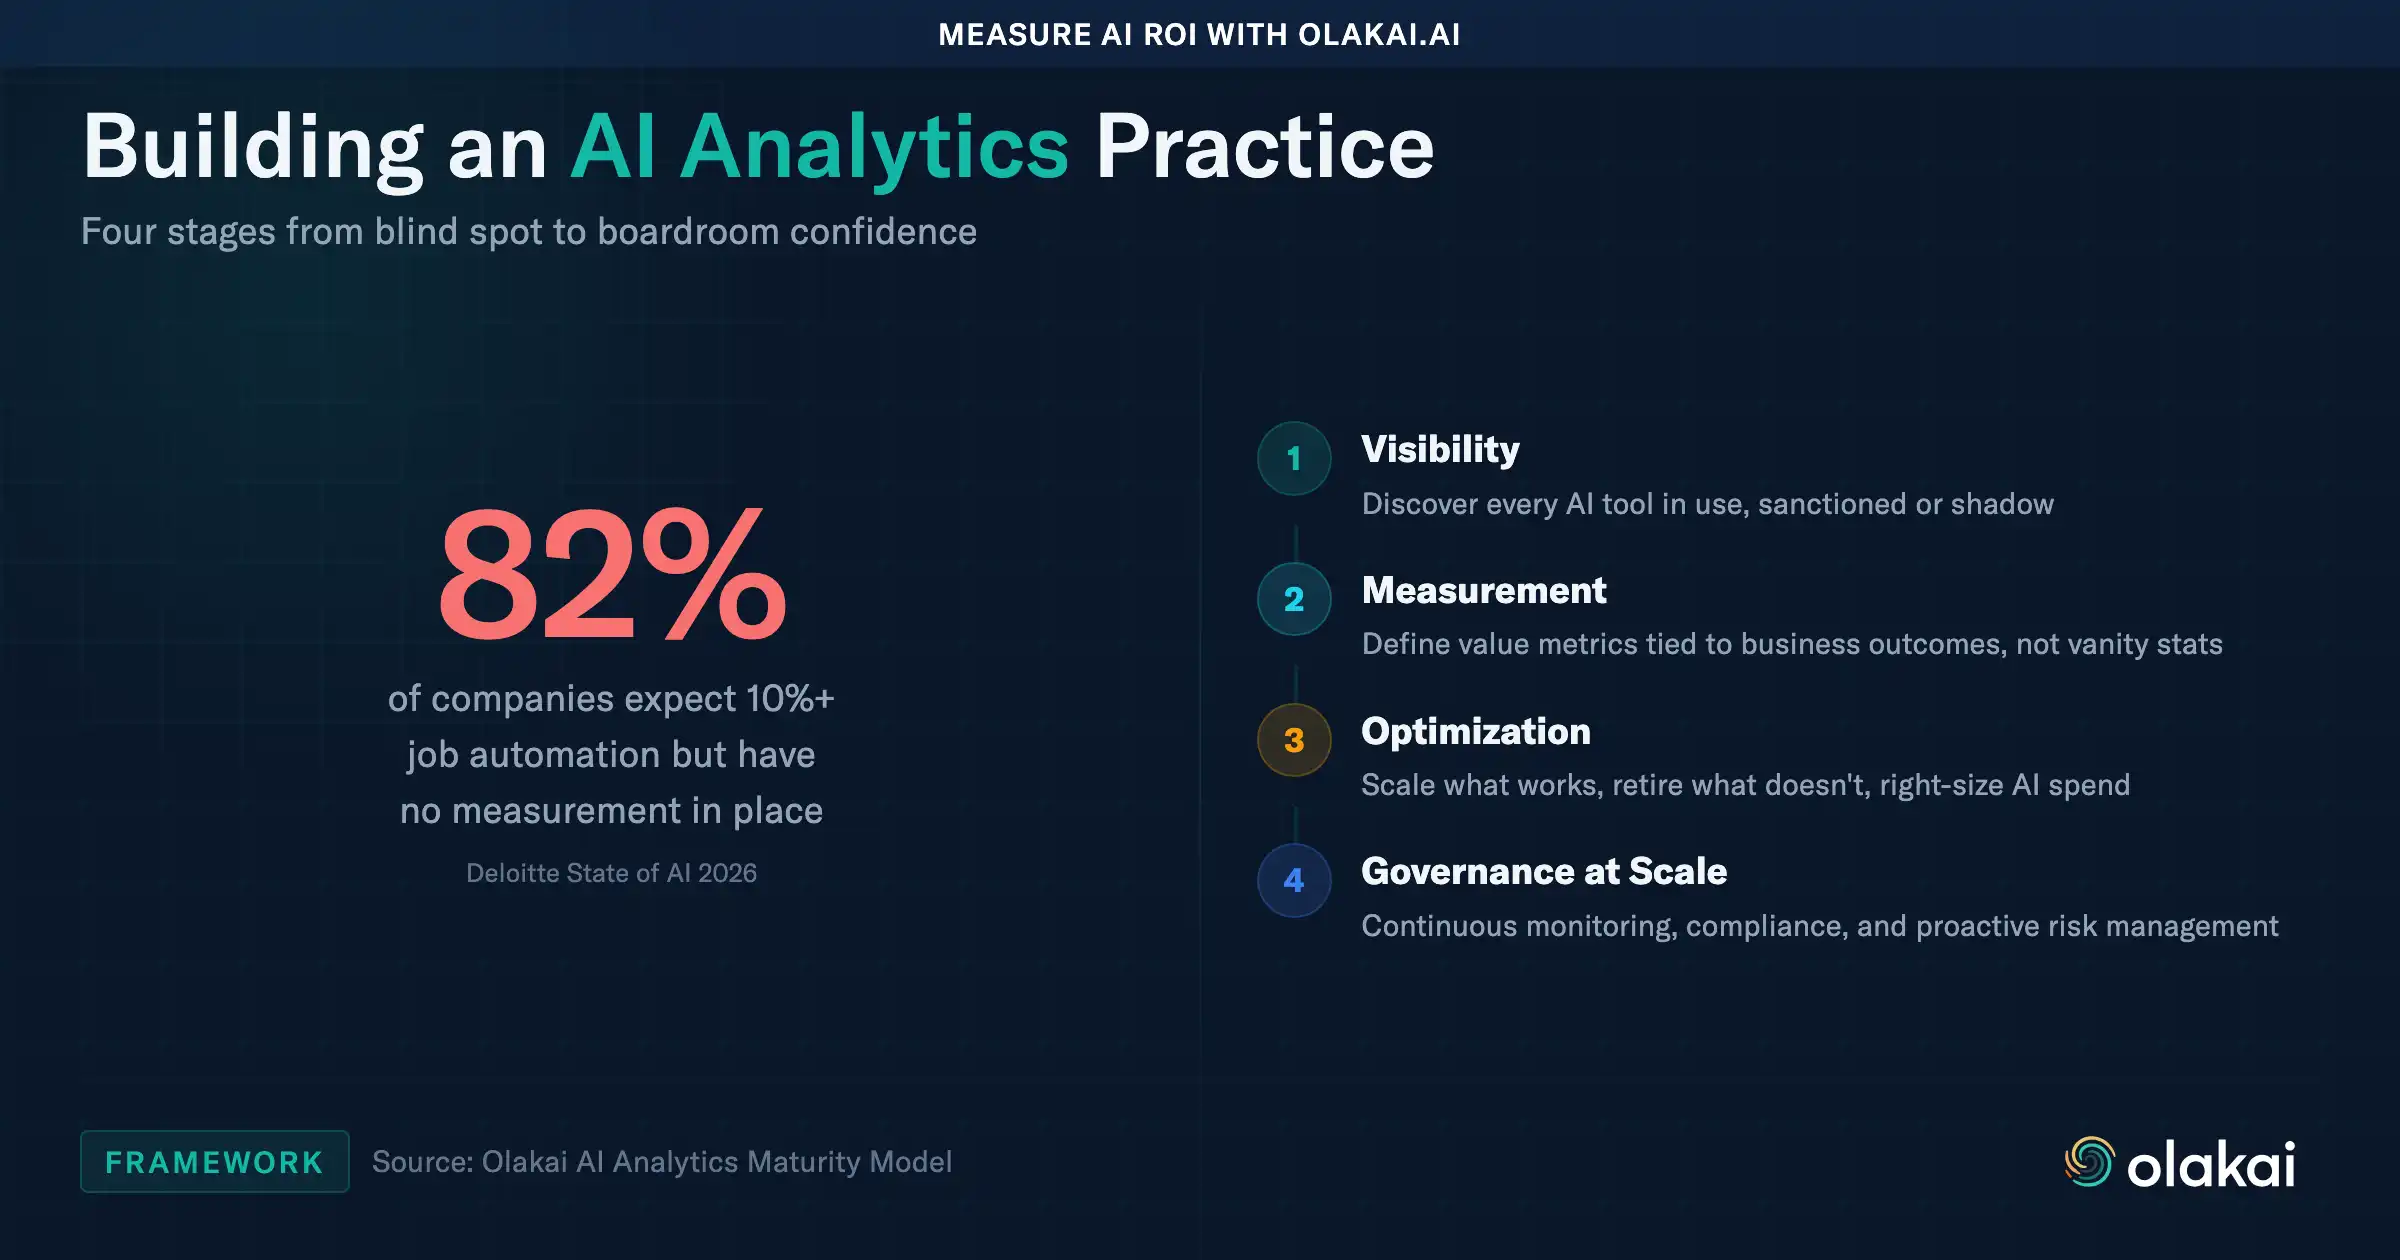
    Building the Framework

    If you’re spending six or seven figures on AI coding tools and can’t answer basic questions about their impact, here’s where to start.

    First, establish a baseline. Before you can measure improvement, you need to know where you stand. What percentage of your pull requests are AI-assisted? What’s your current cycle time for AI-assisted versus non-AI code? What are you spending per developer, per provider, per month? Most engineering organizations can’t answer these questions today.

    Second, segment by cohort. Stop reporting a single adoption number. Break your engineering organization into power users, casual users, new adopters, and idle license holders. Each cohort tells a different story, and each requires a different response.

    Third, connect quality to origin. Track incident rates, security findings, and change failure rates by whether the code was AI-assisted or not. This is the data your board actually needs — not how many lines the AI generated, but whether those lines made your product better or worse.

    Fourth, unify cost visibility. Aggregate spending across Copilot, Cursor, Claude Code, and every other tool your developers are using — including the ones they’re paying for themselves. The enterprise AI revenue gap starts with cost sprawl that nobody can see.

    The organizations that will win the AI coding race aren’t the ones that adopt the most tools. They’re the ones that measure the right things, govern the risks, and make data-driven decisions about where to invest. Your AI coding tools are generating code. The question is whether they’re generating value.

    Want to see how your engineering AI investment is actually performing? Schedule a demo to see Coding IQ in action — vendor-neutral analytics across every AI coding tool your team uses.

  • AI ROI EP. 4: ACT — From Approved Pilot to Enterprise-Wide Impact

    AI ROI EP. 4: ACT — From Approved Pilot to Enterprise-Wide Impact

    A VP of Operations at a $4 billion manufacturer had the data. Three AI pilots had cleared the DECIDE gate with strong cost-to-value ratios. The CFO had approved scaling budgets. The board was expecting results by Q3. Six months later, all three initiatives were still running at pilot scale. One team couldn’t get IT to provision enterprise licenses. Another was waiting for “the right moment” to roll out to the full department. The third had scaled technically but hadn’t changed a single workflow — so the AI was running at production capacity with pilot-level impact.

    Everyone was acting on AI. Nobody was acting systematically. And the gap between “approved for scaling” and “delivering enterprise-wide value” was growing wider every quarter.

    This is the ACT problem — the fourth and final step in the SEE, MEASURE, DECIDE, ACT framework. You’ve mapped your AI ecosystem (SEE). You’ve connected activity to business outcomes (MEASURE). You’ve run structured pilots that produce scaling decisions (DECIDE). Now comes the hardest part: turning those decisions into enterprise-wide results that show up on the P&L.

    The data says most organizations fail here. PwC’s 2025 Global CEO Survey found that nearly half of CEOs see no meaningful return from their generative AI investments. Not low returns — none. Meanwhile, Gartner projects worldwide AI spending will reach $644 billion in 2025 and continue accelerating. The money is flowing. The returns aren’t. And the difference between the enterprises that scale AI successfully and those that don’t isn’t better technology — it’s better execution frameworks for going from “this pilot works” to “this is how we operate.”

    Why Scaling Is Harder Than Piloting

    The pilot-to-production gap is where most AI investments die. S&P Global found that enterprises scrapped 46% of AI pilots before reaching production in 2025, and Bain reported that only 27% of companies successfully moved generative AI from testing to real-world implementation. But even among those that do scale, a separate challenge emerges: scaling the technology without scaling the impact.

    This happens because organizations treat scaling as a deployment problem — more licenses, more compute, more users. But deployment without transformation just gives you a bigger pilot. The AI is running at scale. The workflows haven’t changed. The organizational structures haven’t adapted. And the business outcomes remain stubbornly similar to what you saw with 50 users, even though you now have 5,000.

    Deloitte’s 2026 State of AI survey captured this precisely: while 74% of organizations want AI to drive revenue growth, only about one in five have redesigned workflows around AI capabilities. McKinsey’s data reinforces the point — AI high performers are 2.8 times more likely to redesign workflows than other organizations. Dropping an AI tool into an existing process and hoping for different outcomes isn’t a scaling strategy. It’s wishful thinking at enterprise cost.

    The ACT step addresses this with three frameworks that take organizations from “approved pilot” to “operating at scale”: the CFO Conversation, the Cloning Playbook, and the Operating Rhythm.

    Framework 1: The CFO Conversation

    Every scaling decision eventually becomes a budget conversation. And budget conversations require a language that most AI teams don’t speak fluently: operational economics.

    The CFO doesn’t want to hear that the AI agent “saves time.” She wants to know four things, in this order:

    What’s the operational cost structure? Total cost of ownership at scale: licensing, compute, integration, support, training, and the ongoing cost of maintaining the system. Not the pilot cost extrapolated — the actual production cost model, including volume discounts, infrastructure scaling curves, and the hidden costs that only appear at scale (data quality maintenance, model drift monitoring, edge case handling).

    What’s the counterfactual? What would the organization spend doing this work without AI? This isn’t a theoretical exercise. It’s a concrete comparison: headcount cost, error rates, cycle time, and customer impact in the current state versus the AI-augmented state. The counterfactual is what makes AI ROI defensible. Without it, every efficiency claim is an assertion. With it, it’s arithmetic.

    What’s the scaling math? If the pilot showed a 3:1 return with 50 users, what does the model look like with 5,000? Scaling math isn’t linear. Some costs decrease at scale (per-unit licensing), while others increase (integration complexity, change management, support volume). The CFO wants to see the curve, not just the current point. And she wants to see sensitivity analysis — what happens to the return if adoption is 60% instead of 90%, or if the efficiency gain is 25% instead of the 40% the pilot showed.

    What are the 90-day gates? Enterprise CFOs don’t write blank checks. They fund in stages, with checkpoints tied to measurable outcomes. A 90-day gate structure might look like: month one, deploy to the first full department and validate that pilot-level performance holds at 10x scale; month two, measure the workflow redesign impact and compare against the counterfactual; month three, present the production economics to the executive committee with a recommendation for the next stage of expansion. Each gate has a defined KPI, a target, and a decision: continue, adjust, or stop.

    The enterprises that get CFO buy-in for scaling don’t present dashboards. They present business cases with operational economics, counterfactuals, scaling curves, and stage gates. Building this financial frame before asking for scaling budget is the single most effective way to accelerate AI investment.

    Framework 2: The Cloning Playbook

    Once the first AI initiative scales successfully, the question becomes: how do you replicate that success across the organization? This is where most enterprises lose momentum. Each new AI project starts from scratch — new vendors, new integrations, new measurement frameworks, new governance reviews. The result is that scaling the second initiative takes almost as long as scaling the first.

    The Cloning Playbook treats your first successful AI deployment as a template. It identifies the five elements that made it work — what we call the success DNA — and systematically replicates them in adjacent use cases.

    The business case structure. Not just “we saved money” but the specific format: counterfactual baseline, measured outcome, cost-to-value ratio, risk profile. When the first deployment proved value using this structure, don’t reinvent the wheel for deployment two. Use the same template. The CFO already trusts it.

    The measurement infrastructure. The hardest part of proving AI ROI is building the instrumentation that connects AI activity to business outcomes. If you built that infrastructure for customer service AI, most of it translates to sales AI or operations AI with minor modifications. The data pipelines, the KPI frameworks, the reporting cadences — these are organizational assets, not project artifacts.

    The governance framework. Your governance approach — data classification, security review, compliance validation, risk assessment — was designed and tested during the first deployment. Applying the same framework to deployment two eliminates months of security and legal review. The governance team already knows what “good” looks like.

    The change management pattern. How did you train users? How did you redesign workflows? How did you handle resistance? What worked and what didn’t? The human side of AI deployment is where most organizations lose the most time. Cloning the change management playbook that worked — right down to the communication cadence and the training format — compresses rollout timelines dramatically.

    The executive sponsorship model. Who championed the first deployment? What organizational authority did they need? How did they maintain momentum through obstacles? The sponsorship structure that works for one AI initiative typically works for others, because the organizational dynamics are the same: competing priorities, resource constraints, and stakeholder skepticism that only yields to demonstrated results.

    The math is compelling. Organizations that clone their success DNA from first deployment to second see 70-80% reduction in time-to-value compared to starting from scratch. The first initiative might take nine months to prove ROI. The second takes two to three months, because the infrastructure, governance, measurement, and organizational muscle are already built. By the third and fourth, you’re operating with a repeatable scaling engine.

    The key is identifying adjacent workflows — use cases that share enough similarity with your proven deployment that the success DNA transfers cleanly. If your customer service AI succeeded, the adjacent workflows might be internal helpdesk, partner support, or onboarding. If your sales AI proved value, adjacent workflows might be account management, renewals, or lead qualification. Start with the 70-80% that transfers directly and customize only the 20-30% that’s unique to the new context.

    Framework 3: The Operating Rhythm

    Scaling AI isn’t a project. It’s an operating discipline. The enterprises that sustain AI value over time build measurement and governance into their regular business cadence rather than treating it as a separate workstream.

    The Operating Rhythm runs on three cycles:

    Monthly: Performance Review. Every AI initiative that has passed the DECIDE gate gets reviewed monthly against its defined business KPIs. Not technical metrics — business outcomes. Revenue influenced, costs avoided, risk events prevented, cycle time reduced. This is the same review cadence your organization already uses for other operational metrics. AI just gets added to the agenda. The monthly review catches performance degradation early, identifies optimization opportunities, and keeps executive attention on AI value rather than AI activity. If an initiative’s KPIs are declining, the monthly review triggers investigation before the quarterly review.

    Quarterly: Portfolio Assessment. Every quarter, the AI portfolio gets assessed as a whole. Which initiatives are exceeding their ROI targets? Which are underperforming? Where should the next investment go? This is where the portfolio view that CFOs want becomes actionable. The quarterly assessment looks across all AI investments and asks: given what we now know about performance, risk, and cost, is our portfolio allocation optimal? Should we shift resources from an underperforming initiative to one showing stronger returns? Should we expand a successful deployment to new business units or geographies?

    Annual: Strategic Reset. Once a year, step back from operational metrics and assess the AI strategy against the business strategy. Are the use cases you’re scaling still aligned with where the business is heading? Has the competitive landscape changed in ways that require new AI capabilities? Are there emerging technologies — new model architectures, new vendor offerings, new integration patterns — that create opportunities your current portfolio doesn’t capture? The annual reset prevents the common trap of optimizing last year’s AI strategy while the business has moved on to new priorities.

    The Operating Rhythm does something that ad hoc AI management cannot: it creates organizational accountability. When AI performance is reviewed monthly alongside other business metrics, it signals that AI is a business function, not an experiment. When portfolio allocation is assessed quarterly, it prevents the resource fragmentation that kills scaling momentum. And when strategy is reset annually, it keeps AI investment aligned with business direction.

    The Convergence of Measurement and Governance

    Here’s what becomes clear at the ACT stage: measurement and governance aren’t separate disciplines. They’re two faces of the same capability.

    The enterprises with the strongest AI ROI data are also the ones with the most rigorous governance frameworks. Not because governance is a compliance exercise, but because governance forces the discipline that measurement requires. Defining what AI is allowed to do means defining what it should be doing. Instrumenting how AI performs for compliance also instruments how it performs for ROI. Maintaining audit trails for regulators also maintains the data trails that prove business value.

    This convergence is Olakai’s thesis: that unified visibility across measurement and governance enables enterprises to scale AI with confidence rather than scaling AI and hoping for the best. When you can see every AI system, measure its business impact, govern its risk profile, and control its costs from a single platform, the ACT step becomes dramatically simpler. You’re not stitching together data from five different tools to answer a board question. You’re looking at one dashboard that shows value, risk, and cost together.

    The SEE, MEASURE, DECIDE, ACT playbook isn’t just a methodology. It’s an operating system for enterprise AI. And the ACT step is where that operating system proves its worth — not in a pilot, not in a board presentation, but in sustained, measurable business outcomes that compound quarter over quarter.

    Start Acting With Data

    The 74% of enterprises that want AI revenue growth but can’t prove it share a common failure mode: they act without the infrastructure to know whether their actions are working. They scale without counterfactuals. They expand without cloning success patterns. They operate without cadences that catch problems before they become write-offs.

    The 20% who prove AI ROI do something different. They build the CFO conversation before they ask for scaling budget. They clone their success DNA rather than reinventing each deployment. And they embed AI measurement into their monthly, quarterly, and annual operating rhythms so that AI value isn’t a one-time proof point — it’s a continuous, visible, defensible track record.

    That’s the ACT framework. And it’s the final step that turns AI from an investment line item into a measurable operating advantage.

    Ready to scale your AI investments with confidence? Schedule a demo and we’ll show you how Olakai’s measurement and governance platform turns the SEE, MEASURE, DECIDE, ACT playbook into an operating system for enterprise AI.

  • What Is AI Analytics? The Definitive Enterprise Guide

    What Is AI Analytics? The Definitive Enterprise Guide

    Gartner predicts that 40% of agentic AI projects will be canceled by 2027 due to unclear business value. BCG’s 2025 AI Radar survey of 1,803 C-suite executives found that only 25% of companies report realizing significant value from their AI investments. Thomson Reuters reported in 2026 that just 18% of organizations formally track AI ROI.

    These are not isolated findings. They describe a structural gap in how enterprises manage AI: the gap between deploying AI and actually measuring whether it works. AI analytics is the discipline that closes that gap.

    The Enterprise AI Measurement Gap: BCG reports only 25% of companies see significant AI value, PwC finds 56% of CEOs report no revenue increase from AI, and Thomson Reuters shows only 18% of organizations formally track AI ROI.
    The measurement gap: most enterprises invest in AI but cannot prove it works.

    What Is AI Analytics?

    AI analytics is the practice of measuring the usage, performance, cost, and business impact of artificial intelligence tools across an enterprise. It answers the questions that every CIO, CFO, and board member is now asking: What AI are we using? How much is it costing us? And what are we getting back?

    Traditional business intelligence measures the outputs of human processes. AI analytics measures the outputs of AI-augmented and AI-automated processes. This includes everything from how often employees use a chatbot like ChatGPT or Copilot, to the success rate and cost-per-execution of autonomous agents running multi-step workflows in production.

    The distinction matters because AI adoption has outpaced AI measurement by years. Most enterprises now have dozens of AI tools in active use, each with its own vendor dashboard or no analytics at all. AI analytics provides a unified, vendor-neutral view across all of them.

    Why AI Analytics Matters Now

    The urgency is driven by three converging forces.

    The ROI reckoning. Deloitte’s State of AI 2026 survey of 3,235 business and IT leaders found that 74% of organizations want AI to grow revenue, but only 20% have actually seen it happen. PwC’s 2026 Global CEO Survey found that 56% of CEOs report no revenue increase from AI. Boards are no longer willing to fund AI programs on faith. They want numbers. AI analytics provides those numbers.

    The agentic AI wave. Deloitte projects that agentic AI usage will surge from 23% to 74% of enterprises within two years. Unlike chatbots that wait for human prompts, agentic AI takes autonomous actions: executing workflows, calling APIs, making decisions. An ungoverned chatbot gives a bad answer. An ungoverned agent executes a bad decision at scale. Measuring agent performance is not optional. It is the difference between a controlled deployment and an operational risk.

    The shadow AI problem. Employees are adopting AI tools faster than IT can track them. Shadow AI creates blind spots in security, compliance, and cost management. AI analytics starts with visibility: discovering what AI is actually being used, by whom, and for what purpose.

    The Four Pillars of AI Analytics

    A complete AI analytics practice spans four areas. Each one addresses a different question that enterprise leaders need answered.

    The Four Pillars of AI Analytics: Usage and Adoption, Performance and Quality, Cost and ROI, Risk and Governance.
    The four pillars of a complete AI analytics practice.

    1. Usage and Adoption Analytics

    This is the foundation: understanding what AI tools are in use across the organization and how deeply they are being adopted. Usage analytics answers questions like: How many employees actively use ChatGPT? Which teams have adopted Copilot? What percentage of licensed AI tools are actually being used?

    Without usage data, enterprises operate blind. They cannot optimize license spend because they do not know which tools are underutilized. They cannot identify shadow AI because they do not have a baseline of sanctioned usage to compare against. According to Deloitte, workforce access to sanctioned AI tools expanded from under 40% to roughly 60% of employees in a single year. That growth rate makes continuous usage tracking essential.

    2. Performance and Quality Analytics

    Beyond knowing that AI is being used, enterprises need to know whether it is performing well. Performance analytics measures the quality and reliability of AI outputs across tools and use cases.

    For assistive AI (chatbots and copilots), this includes response accuracy, user satisfaction, and task completion rates. For agentic AI, it includes execution success rates, failure analysis, and decision quality. A custom agent that processes insurance claims might have a 94% success rate, but the 6% failure rate could represent millions in incorrectly handled claims. Performance analytics surfaces these patterns before they become problems.

    3. Cost and ROI Analytics

    This is where AI analytics becomes strategic. Cost analytics tracks the total cost of AI operations: API calls, compute, licensing, and human oversight time. ROI analytics ties those costs to business outcomes: revenue influenced, time saved, cost avoided, error reduction.

    BCG found that 60% of enterprises do not track financial KPIs for their AI programs. This means the majority of organizations cannot answer the most basic question their CFO will ask: Is our AI investment paying off? AI ROI measurement is the capability that separates enterprises scaling AI from those stuck in pilot purgatory.

    The math is straightforward but requires instrumentation. If a customer service AI handles 10,000 tickets per month at $0.12 per interaction and replaces a process that previously cost $8.50 per ticket with human agents, the monthly savings are $83,800. Without AI analytics, that number is an estimate. With it, that number is auditable and provable to a board.

    4. Risk and Governance Analytics

    The fourth pillar connects analytics to governance. Risk analytics monitors AI usage for policy violations, data exposure, bias indicators, and compliance gaps. It answers questions like: Are employees sharing sensitive data with AI tools? Are autonomous agents operating within defined guardrails? Are AI outputs meeting regulatory requirements?

    This pillar is increasingly non-negotiable. The EU AI Act mandates risk-based oversight. The NIST AI Risk Management Framework provides voluntary guidance that is rapidly becoming the de facto standard in the United States. Companies in regulated industries such as financial services, healthcare, and government cannot scale AI without demonstrating continuous risk monitoring.

    AI Analytics vs. Traditional Observability

    Engineering teams are familiar with observability tools like Datadog, New Relic, and Splunk. These tools monitor infrastructure: server uptime, latency, error rates, and throughput. They are necessary but insufficient for AI programs.

    AI analytics differs from traditional observability in three fundamental ways.

    It measures business outcomes, not just technical metrics. Datadog can tell you that an API call to GPT-4 took 1.2 seconds. AI analytics tells you that the same call saved a sales rep 14 minutes of research and contributed to a deal worth $240,000. The audience is the CIO and CFO, not only the engineering team.

    It spans tools and vendors. Each AI vendor provides metrics for its own tool. Microsoft shows Copilot usage. OpenAI shows ChatGPT usage. Salesforce shows Einstein usage. But no vendor will ever show you the cross-vendor picture, because that is not in their interest. AI analytics provides vendor-neutral visibility across the entire AI ecosystem.

    It connects usage to governance. Traditional observability does not care whether an employee pasted customer PII into a chatbot. AI analytics does. The integration of usage data, risk signals, and governance policy into a single platform is what makes AI analytics a strategic capability rather than just another dashboard.

    What to Measure: Key AI Analytics Metrics

    The specific metrics that matter depend on the type of AI being measured and the audience consuming the data. Here is a framework organized by stakeholder.

    For the CIO and Board

    • AI ROI by business unit: Revenue influenced, cost saved, and time recovered, broken down by department or function
    • Adoption rate: Percentage of employees actively using AI tools, tracked over time
    • AI maturity score: A composite metric reflecting how effectively the organization uses AI across adoption, measurement, and governance
    • Risk posture: Number and severity of policy violations, shadow AI instances, and compliance gaps

    For the CFO

    • Total cost of AI: All-in spend across licensing, API usage, compute, and personnel
    • Cost per AI interaction: What each chatbot conversation, agent execution, or copilot suggestion costs
    • License utilization: Percentage of paid AI licenses that are actively used. Low utilization signals wasted spend.
    • ROI by AI initiative: For each major AI program, what is the measurable return relative to the investment?

    For the CISO

    • Shadow AI inventory: Unauthorized AI tools in use, how many users, what data they access
    • Data exposure incidents: Instances of sensitive data shared with AI tools
    • Policy compliance rate: Percentage of AI interactions that comply with content and data policies
    • Agent guardrail adherence: For autonomous agents, how often do they operate within defined boundaries?

    For Engineering and AI Teams

    • Agent success rate: Percentage of agent executions that complete successfully
    • Latency and throughput: Response times and processing capacity
    • Error classification: Types and frequency of AI failures, broken down by cause
    • Model comparison: Performance and cost differences across AI models and vendors for the same task

    How to Build an AI Analytics Practice

    Organizations typically progress through four stages when building an AI analytics capability. Understanding where you are today helps determine the right next step.

    The Four Stages of AI Analytics Maturity: Stage 1 Visibility, Stage 2 Measurement, Stage 3 Optimization, Stage 4 Governance at Scale.
    Building AI analytics capability: from visibility to governance at scale.

    Stage 1: Visibility

    The first step is simply knowing what AI is in use. Most enterprises are surprised by the results of an AI visibility audit. Shadow AI is nearly universal: employees are using AI tools that IT has not sanctioned, often with company data. Stage 1 focuses on discovery and inventory: building a complete picture of the AI tools, users, and data flows across the organization.

    Stage 2: Measurement

    Once you have visibility, you can start measuring. This means defining the metrics that matter for each AI initiative and instrumenting systems to capture them. The key shift at this stage is moving from vanity metrics (number of prompts, number of users) to value metrics (time saved, revenue influenced, cost avoided). Olakai’s SEE, MEASURE, DECIDE, ACT framework provides a structured approach to this transition.

    Stage 3: Optimization

    With measurement in place, enterprises can make data-driven decisions about their AI programs. Which tools deliver the highest ROI? Which pilots should scale to production? Which agents should be retired? Structured pilot programs with clear success criteria replace the ad hoc experimentation that traps most organizations in pilot purgatory. Optimization also includes cost management: identifying redundant tools, right-sizing API usage, and negotiating vendor contracts with actual usage data.

    Stage 4: Governance at Scale

    The final stage integrates analytics with governance. As AI programs grow from a handful of pilots to hundreds of production deployments, the analytics framework must support policy enforcement, compliance reporting, and risk management at scale. This is where organizations move from reactive oversight (responding to incidents) to proactive governance (preventing them). Analytics provides the continuous monitoring that makes proactive governance possible.

    The Vendor-Neutral Imperative

    One of the most common mistakes enterprises make is relying on AI vendors to provide their own analytics. Microsoft offers Copilot usage dashboards. OpenAI offers a usage portal for ChatGPT Enterprise. Salesforce shows Einstein adoption metrics. Each provides useful data about its own tool. None will ever provide the cross-vendor picture.

    This is not a criticism of those vendors. It is a structural limitation. Microsoft has no incentive to show you that a competitor’s tool outperforms Copilot for a given use case. OpenAI has no incentive to help you discover that your team stopped using ChatGPT and switched to Claude. The only way to get an honest, complete picture of AI performance across your organization is through a vendor-neutral analytics platform that sits above individual tools.

    Olakai was built specifically for this purpose. The platform provides unified visibility across chatbots, copilots, agents, and AI-enabled SaaS, with custom KPIs tied to business outcomes rather than vendor-specific metrics.

    Frequently Asked Questions

    What is the difference between AI analytics and AI observability?

    AI observability focuses on the technical performance of AI systems: latency, error rates, model accuracy, and infrastructure health. AI analytics extends beyond technical metrics to include business outcomes, ROI measurement, cost analysis, and governance. Observability tells you whether the system is running. Analytics tells you whether it is delivering value.

    How do you measure AI ROI?

    AI ROI is measured by comparing the total cost of an AI initiative (licensing, compute, API calls, implementation, and human oversight) against the measurable business value it creates (time saved, revenue influenced, cost avoided, error reduction). The key is instrumenting AI systems to capture both sides of this equation continuously, not just during quarterly reviews. Olakai’s AI ROI measurement capability automates this process across all AI tools.

    What is shadow AI and why does it matter for analytics?

    Shadow AI refers to AI tools used by employees without IT approval or oversight. It matters for analytics because you cannot measure what you cannot see. If 30% of your AI usage is happening in unsanctioned tools, your analytics are incomplete, your cost estimates are wrong, and your security posture has blind spots. Shadow AI detection is typically the first step in building an AI analytics practice.

    Do you need a dedicated platform for AI analytics?

    For organizations with one or two AI tools, vendor-provided dashboards may suffice. For enterprises using multiple AI tools across multiple teams, vendor dashboards create fragmented, siloed views. A dedicated AI analytics platform provides the unified, vendor-neutral perspective needed to make strategic decisions about the AI program as a whole, not just individual tools in isolation.

    What industries benefit most from AI analytics?

    Every industry deploying AI at scale benefits from analytics, but the urgency is highest in regulated industries. Financial services, healthcare, and government face regulatory requirements that demand continuous monitoring and audit-ready evidence. Technology companies benefit from the ROI optimization angle: understanding which AI investments deliver the highest return.

    Key Takeaways

    • AI analytics is the practice of measuring AI usage, performance, cost, and business impact across an enterprise
    • Only 25% of companies report significant value from AI (BCG), and only 18% formally track AI ROI (Thomson Reuters). The measurement gap is the primary barrier to scaling AI programs.
    • The four pillars are usage analytics, performance analytics, cost and ROI analytics, and risk and governance analytics
    • AI analytics differs from traditional observability by measuring business outcomes, spanning vendors, and integrating governance
    • Vendor-neutral analytics is essential because no AI vendor will provide an honest cross-vendor picture
    • Building an AI analytics practice follows four stages: visibility, measurement, optimization, and governance at scale

    Schedule a demo to see how Olakai provides vendor-neutral AI analytics across your entire AI ecosystem.

  • The 30-Day AI Pilot That Actually Proves Value

    The 30-Day AI Pilot That Actually Proves Value

    Seventeen active AI pilots. $2.3 million in annual spend. Zero measurable business outcomes. That was the state of AI at a mid-market professional services firm when their CFO finally asked the question everyone had been avoiding: “Which of these should we actually scale?”

    Nobody could answer. Not because the pilots weren’t working — several were. But none had been designed to produce the data needed to make a scaling decision. They were experiments without exit criteria, running indefinitely on the premise that “we’ll figure out ROI later.” Later never came.

    This is pilot purgatory — and MIT’s 2025 State of AI research found that 95% of enterprise AI pilots deliver zero measurable financial return. Not low returns. Zero. That’s roughly $30-40 billion in destroyed shareholder value from AI pilots running worldwide without the measurement infrastructure to prove they’re worth continuing.

    The Pilot Purgatory Problem

    The data on AI pilot failure is stark. S&P Global Market Intelligence found that the average enterprise scrapped 46% of AI pilots before they ever reached production in 2025. Bain’s executive survey reported that only 27% of companies successfully moved generative AI from testing to real-world implementation. And McKinsey’s State of AI report found that nearly two-thirds of organizations remain stuck in pilot phase, unable to scale projects across the enterprise despite significant adoption.

    The financial toll is substantial. Industry analysis estimates that pilot purgatory costs the average enterprise $15-25 million annually in wasted development resources, infrastructure spending, and opportunity costs. Individual pilot failures run $500,000 to $2 million each. And the cost grows every month a pilot runs without producing decision-quality data, because the organization continues investing without the information needed to decide whether that investment is justified.

    The root cause isn’t technical. Most AI pilots work from a technical standpoint — the models perform, the integrations function, the users adopt the tools. The root cause is that pilots are designed to test technology, not prove business value. They answer “can this AI tool do the thing?” when the question the organization needs answered is “should we invest more in this AI tool?”

    Why 30 Days Is the Right Timeframe

    Enterprise best practice points to a 30-to-45-day window as the optimal pilot duration. Short enough to maintain executive attention and organizational momentum. Long enough to generate statistically meaningful data on business outcomes.

    Shorter pilots (under three weeks) don’t capture enough data to distinguish signal from noise, especially for use cases where business outcomes lag behind AI activity — like lead qualification, where the revenue impact shows up when leads close, not when they’re scored. Longer pilots (three to four months) generate more data but introduce a different risk: losing stakeholder attention. By month three, the executive sponsor has moved on, the team working on the pilot has been pulled to other priorities, and the pilot drifts into that twilight zone where it’s too expensive to kill and too poorly measured to champion.

    The 30-day pilot isn’t about speed for its own sake. It’s about creating a forcing function — a defined moment where the organization must decide: scale, fix, or kill. That decision point is what separates pilots that generate value from pilots that generate costs.

    Pre-Pilot: Setting Up for a Decision

    The 30-day clock doesn’t start when the AI tool gets deployed. It starts when the measurement infrastructure is in place. Before the pilot begins, four things must be defined:

    The business outcome KPI. Not “accuracy” or “adoption” — the business outcome that this AI initiative should change. Revenue influenced, costs reduced, time recovered, errors prevented. This is the metric that will appear in the scaling decision. If you can’t name it before the pilot starts, you’re not ready for the pilot. Our AI ROI framework provides a methodology for identifying the right success KPI by use case.

    The baseline. What is the current performance on that KPI without AI? If the AI agent is supposed to reduce customer support resolution time, what’s the current average? If it’s supposed to improve lead conversion, what’s the current conversion rate? Without a baseline, there is no counterfactual, and without a counterfactual, there’s no way to attribute improvement to AI versus other factors.

    The success threshold. How much improvement constitutes a “scale” decision? What range triggers a “fix” decision? What level triggers a “kill” decision? These thresholds must be agreed upon before the data comes in. Post-hoc threshold setting is subject to confirmation bias — teams will unconsciously set the bar wherever the data lands.

    The decision authority. Who makes the scale/fix/kill call on day 30? If this isn’t defined upfront, the pilot’s data will be debated indefinitely by stakeholders with competing interests. The decision authority needs to be a single individual (typically the executive sponsor) with the organizational power to allocate or reallocate budget based on the results.

    During the Pilot: What to Measure

    Once the pilot is running, measurement operates on two tracks.

    The outcome track measures the business KPI you defined pre-pilot. This is the number that matters for the scaling decision. Track it weekly so you can see trend direction, but don’t make decisions based on week-one data. Enterprise AI use cases need at least two to three weeks for patterns to stabilize, especially in workflows with downstream dependencies like sales pipeline or compliance review.

    The diagnostic track measures operational and technical metrics that help you understand why the outcome KPI is moving (or not). If resolution time is dropping, the diagnostic track tells you whether that’s because the AI is providing better answers, because agents are spending less time searching for information, or because the easiest tickets are being routed to AI first. If the outcome KPI isn’t improving, the diagnostic track tells you where to look: data quality issues, workflow integration problems, user adoption gaps, or a fundamental mismatch between the AI capability and the business need.

    McKinsey’s research is clear on the value of this approach: organizations that define and track AI-specific KPIs see nearly two-thirds meet or exceed their targets. The measurement itself doesn’t cause success — the discipline of defining what matters and instrumenting it creates organizational clarity that makes success more likely.

    Day 30: The Decision Point

    This is where most enterprises fail — not because they lack data, but because they lack a framework for using it. The day-30 decision uses four inputs:

    Outcome KPI performance vs. threshold. Did the AI initiative hit the success threshold you defined pre-pilot? If yes, the data supports scaling. If it’s in the “fix” range, the diagnostic data tells you what to change. If it’s below the “kill” threshold, the data supports sunsetting the initiative and reallocating resources. The threshold was set before the data arrived, so this isn’t a subjective judgment. It’s a data-driven decision.

    Cost-to-value ratio. What was the total cost of the pilot (tooling, infrastructure, team time, opportunity cost) versus the total value generated? Even at pilot scale, this ratio signals whether scaling will be financially viable. If the cost-to-value ratio is favorable at pilot scale, it typically improves at production scale due to economies.

    Governance and risk profile. Can the AI initiative operate within your organization’s risk tolerance at production scale? Data security concerns, compliance requirements, and governance gaps that are manageable at pilot scale can become critical at production scale. If the governance profile isn’t ready for scaling, the decision might be “fix governance first, then scale.”

    Operational readiness. Does the organization have the operational capacity to absorb the change at scale? User training, workflow integration, support infrastructure, and change management all need to be assessed. A pilot that works with 50 engaged early adopters may perform differently when deployed to 5,000 users with varying levels of enthusiasm and technical proficiency.

    What Successful Enterprises Do Differently

    The enterprises that escape pilot purgatory share three characteristics. First, they secure executive sponsorship with decision authority, not just endorsement. Organizations with top-level executive mandate scale AI three times faster and achieve significantly higher revenue impact compared to those stuck at pilot stage.

    Second, they instrument measurement from day one, not after the pilot shows promising results. This means defining KPIs, establishing baselines, and deploying tracking before the AI tool goes live — not retrofitting measurement after the fact. Retrofitting measurement costs three to four times more than building it in from the start and produces lower-quality data because the baseline period is missing.

    Third, they redesign workflows rather than just deploying tools. McKinsey found that AI high performers are 2.8 times more likely to redesign workflows (55% versus 20%) compared to other organizations. Dropping an AI tool into an existing workflow and measuring whether the workflow speeds up is the lowest-value form of AI measurement. Redesigning the workflow around AI capabilities and measuring the redesigned outcome is where the step-change improvements come from.

    Breaking Free

    Pilot purgatory isn’t a technology problem. It’s a measurement problem. The AI works. The organization just can’t prove it — because it never built the measurement infrastructure to generate decision-quality data in a defined timeframe.

    The 30-day structured pilot is the DECIDE step in the SEE, MEASURE, DECIDE, ACT playbook. (This is the third of four companion deep-dives — see also SEE, MEASURE, and ACT.) It takes the visibility data from SEE and the business metrics from MEASURE and converts them into a concrete decision: scale, fix, or kill. No more indefinite experiments. No more “let’s give it another quarter.” No more pilot purgatory.

    The enterprises moving from AI experimentation to business impact are the ones that commit to structured measurement before the pilot starts and structured decisions when the data comes in. The framework isn’t complicated. The discipline is what’s hard. And the cost of avoiding it — $15-25 million per year in wasted pilot investment — far exceeds the cost of getting it right.

    Ready to run an AI pilot that actually produces a decision? Schedule a demo and we’ll show you how Olakai instruments AI measurement from day one — so your 30-day pilot generates the data your board needs to say yes.

  • The Enterprise Leader’s Toolkit for Navigating Agentic AI

    The Enterprise Leader’s Toolkit for Navigating Agentic AI

    Last quarter, a CIO at a mid-market financial services firm told me something that stuck: “I have 14 browser tabs open right now—vendor whitepapers, analyst reports, a McKinsey deck from 2024, three Medium posts about agent architectures. None of them agree on anything, and none of them tell me what to actually do on Monday morning.”

    He’s not alone. According to McKinsey’s 2025 State of AI survey, 62% of organizations are experimenting with AI agents—but in any given business function, no more than 10% have actually scaled them. The gap between “we’re exploring agentic AI” and “we’re getting value from agentic AI” has become the defining challenge for enterprise leaders this year.

    The Practical Resource Gap

    The information problem isn’t a lack of content—it’s a lack of useful content. Vendor guides are biased toward their own platforms. Academic research is fascinating but rarely translates to a Monday morning action plan. And the consulting firms that produce genuinely practical frameworks charge $50,000 or more for the privilege of reading them.

    Meanwhile, Gartner predicts that over 40% of agentic AI projects will be canceled by the end of 2027, citing escalating costs, unclear business value, and inadequate risk controls. Their analysts note that most agentic AI propositions today “lack significant value or return on investment, as current models don’t have the maturity and agency to autonomously achieve complex business goals.” When 40% of projects are headed for cancellation, the difference between success and failure often comes down to whether leaders had the right planning tools before they started.

    Enterprise leaders need something in between a sales pitch and an academic paper—practical, vendor-neutral resources that help them evaluate, plan, and govern agentic AI with clear eyes. That’s exactly what we built.

    Introducing Future of Agentic

    Future of Agentic is a free, comprehensive research site designed for enterprise leaders navigating agentic AI. No gating, no lead forms, no vendor spin. It’s the resource we wished existed when we started building Olakai—and the one we kept hearing customers ask for. Here’s what’s inside.

    A KPI Library Built for Business Leaders, Not Data Scientists

    One of the most common questions we hear is deceptively simple: “How do I know if my AI agent is actually working?” The interactive KPI library provides 18 metrics across agentic, chatbot, and AI application categories—each with definitions, calculation methods, benchmarks, and guidance on when to use them. These aren’t abstract metrics. They’re the specific measurements that separate organizations scaling AI successfully from those stuck in pilot purgatory. Think agent task completion rate, autonomous resolution percentage, and cost per automated decision—KPIs that connect directly to business outcomes your CFO will understand.

    ROI Calculators That Go Beyond Napkin Math

    Every enterprise leader considering agentic AI needs to answer two financial questions: What will this actually cost, and what happens when agents stop delivering value? The Agent Economics section includes two interactive calculators. The Agent TCO vs. FTE calculator models the real total cost of ownership—infrastructure, maintenance, monitoring, and iteration—against human equivalents over time. The Zombie Agent Cost calculator tackles a problem most vendors don’t want to discuss: the ongoing expense of agents that are deployed but no longer delivering meaningful results. Both tools produce shareable outputs, so you can bring data-backed projections to budget conversations instead of guesswork.

    Hundreds of Enterprise Use Cases, Sorted by What Matters

    The use case library catalogs hundreds of enterprise applications of agentic AI, each with architecture context and complexity ratings. What makes this different from a typical “top 10 use cases” listicle is the filtering: sort by department, by implementation complexity, or by business function to find the applications that match your organization’s maturity and priorities. Whether you’re a head of customer success exploring automated escalation workflows or a CISO evaluating security operations agents, the library narrows the field to what’s relevant.

    Governance Frameworks for the Enterprise, Not the Lab

    The Deloitte State of AI 2026 report found that only 21% of organizations have mature AI governance models in place—even as 38% are actively piloting AI agents. That governance gap is a ticking clock. The governance section on Future of Agentic provides risk assessment frameworks, compliance checklists, and decision-making guides built for enterprise reality. These aren’t theoretical policy templates — they complement our own CISO governance checklist and are structured around the actual decisions leaders face: What level of autonomy should this agent have? What happens when it fails? Who’s accountable? How do we audit it?

    An AI Readiness Quiz (30 Seconds to Your Roadmap)

    Sometimes the most valuable tool is the simplest. The AI readiness assessment takes about 30 seconds, asks targeted questions about your organization’s current AI maturity, and produces a customized roadmap with recommended next steps. It’s not a lead-gen funnel—it runs entirely in the browser and gives you immediate, actionable output. We’ve seen leaders use it to align executive teams on where they actually stand versus where they think they stand, which often turns out to be a more productive conversation than any strategy offsite.

    The Enterprise AI Unlocked Podcast

    Research and frameworks are essential, but there’s no substitute for hearing how other leaders are navigating these challenges in practice. Enterprise AI Unlocked features in-depth conversations with enterprise leaders and practitioners—from Fortune 500 AI playbooks to the real economics of voice AI deployments. Six episodes are live, with new conversations publishing regularly. Each episode is enriched with chapters and participant context so you can jump directly to the topics that matter most to you.

    Who This Is For

    We built Future of Agentic for the people making decisions about AI in their organizations: CIOs evaluating agent architectures, CISOs building governance frameworks, CFOs modeling AI agent ROI, and Heads of AI or Data leading implementation. But it’s equally valuable for the product managers, directors, and team leads who need to build informed business cases and present them upward. Everything on the site is free and ungated—because we believe better-informed leaders make better decisions, regardless of whether they ever become Olakai customers.

    Where Olakai Fits

    Future of Agentic is the research and planning phase—understanding what’s possible, modeling the economics, and building a governance framework before you deploy. Olakai is the execution and measurement phase—tracking ROI, governing risk, controlling costs, and securing AI usage once agents are live in production. The two are complementary by design: plan with Future of Agentic, then measure and govern with Olakai.

    Start Exploring

    If your team is navigating agentic AI decisions right now—or preparing to—explore Future of Agentic. Start with the KPI library if you need measurement frameworks, the use case library if you’re evaluating where agents fit, or the readiness quiz if you want a quick pulse on organizational maturity. And when you’re ready to move from planning to production, schedule a demo of Olakai to see how measurement and governance work in practice.

  • AI Metrics That Matter: What CFOs Actually Want to See

    AI Metrics That Matter: What CFOs Actually Want to See

    A CFO recently told us she received an AI progress report from her technology team. It showed 92% employee adoption, 10,000 daily prompts, 4.3 out of 5 user satisfaction, and 99.7% uptime. She looked at it for thirty seconds and asked one question: “How much revenue did this generate?” The room went quiet.

    That silence is playing out in boardrooms everywhere. McKinsey’s State of AI research found that fewer than 20% of enterprises track defined KPIs for their generative AI initiatives. Not 20% track them well — 20% track them at all. Yet tracking those KPIs is the single strongest predictor of whether AI delivers bottom-line impact.

    This is the MEASURE problem — the second step in the SEE, MEASURE, DECIDE, ACT framework. (This is the second of four companion deep-dives — see also SEE, DECIDE, and ACT.) Once you can see what AI is running across your organization, the next challenge is measuring what actually matters. And what matters to the CFO is almost never what technology teams measure first.

    The Metrics Theater Problem

    Eighty-seven percent of CFOs say AI will be extremely or very important to finance operations in 2026, according to Deloitte’s CFO Signals survey. They’re allocating budget accordingly — tech spending on AI is expected to rise from 8% to 13% of total technology budgets over the next two years. Yet only 21% of active AI users report that AI has delivered clear, measurable value.

    The problem isn’t that AI fails to deliver value. It’s that organizations measure the wrong things. They track adoption rates, session counts, and user satisfaction — metrics that answer “are people using AI?” but not “is AI making us money?” IBM found that 79% of organizations see productivity gains from AI, but only 29% can measure ROI confidently. The productivity is real. The measurement isn’t.

    This creates what we call metrics theater: impressive dashboards full of activity data that tell a compelling adoption story but can’t answer a single P&L question. The CFO doesn’t care that 10,000 prompts were submitted yesterday. She cares that the customer success team’s AI-assisted response time dropped from 4 hours to 45 minutes, which reduced churn by 12%, which saved $2.3 million in annual recurring revenue. That’s the same data, measured differently — and only the second version survives a board meeting.

    Vanity Metrics vs. Value Metrics

    The distinction matters because it determines what gets funded. When you present vanity metrics, the board sees cost without context. When you present value metrics, the board sees investment with returns.

    Vanity metrics tell you AI is being used. They include adoption rate (percentage of employees who have logged in), volume metrics (prompts submitted, queries processed, tokens consumed), technical performance (latency, accuracy, uptime), and user sentiment (satisfaction surveys, NPS from internal users). These metrics matter to engineering teams managing infrastructure. They are meaningless to the people who control the budget.

    Value metrics tell you AI is producing outcomes. They include revenue impact (deals influenced, leads converted, upsell driven by AI recommendations), cost reduction (hours saved multiplied by fully loaded labor cost, infrastructure cost avoided, error remediation reduced), risk metrics (compliance incidents prevented, data exposure avoided, audit findings reduced), and time-to-outcome (cycle time compression, faster time to market, reduced mean time to resolution).

    McKinsey’s research is unambiguous on this point: organizations that tie AI to specific business KPIs are significantly more likely to report EBIT impact than those that track only usage. The metric itself isn’t what drives results — the discipline of connecting AI activity to business outcomes is what drives results.

    What CFOs Actually Want to See

    After working with finance leaders across industries, the requests cluster into four categories:

    Hard ROI — dollars in, dollars out. CFOs want to see the investment (AI tooling costs, infrastructure, implementation, training) alongside the return (labor cost reduction, operational efficiency gains, revenue influenced). Not estimates. Not projections based on “time saved.” Actual financial impact traced to specific AI initiatives. This is where most enterprises fall short, because connecting AI activity to downstream financial outcomes requires measurement infrastructure that most organizations haven’t built.

    Portfolio view — which bets are paying off. CFOs don’t manage single projects. They manage portfolios. They want to see all AI investments side by side: cost-to-value ratio by use case, department, and AI tool. Which of the fifteen AI initiatives running across the organization are generating returns? Which should be scaled? Which should be sunset? Without this portfolio view, every budget conversation becomes a case-by-case negotiation instead of a strategic allocation.

    Risk-adjusted returns — the full picture. Revenue and cost savings are only part of the equation. CFOs also need to see the risk profile of AI initiatives: compliance exposure, data security incidents, governance gaps. An AI agent that saves $500,000 annually but creates unquantified regulatory risk isn’t necessarily a good investment. The metric that matters is risk-adjusted return — and that requires integrating governance data with performance data.

    Forward-looking indicators — where to invest next. Historical ROI data is table stakes. CFOs want leading indicators: which AI capabilities are showing early traction? Where are adoption curves steepest? Which teams are seeing productivity gains that haven’t yet translated to financial outcomes but will? The World Economic Forum found that AI ROI payback typically takes 2-4 years — far longer than the 7-12 months expected for typical technology investments. Leading indicators help CFOs maintain investment conviction during that gap.

    Why Technical Metrics Don’t Predict Business Outcomes

    There’s a persistent assumption in enterprise AI that better technical performance equals better business results. It rarely does.

    An AI model can have 99% accuracy and deliver zero business value — if it’s solving a problem nobody cares about. An AI agent can process 50,000 queries per day with sub-second latency and produce no measurable revenue impact — if those queries don’t connect to business workflows that generate outcomes. MIT’s research found that 95% of generative AI pilots technically succeed but yield no tangible P&L impact. The technical metrics are green. The business impact is zero.

    This disconnect exists because technical metrics measure the AI system’s performance, not its contribution. Accuracy, latency, throughput, and error rates tell you whether the model is working correctly. They don’t tell you whether it’s working on the right things, for the right people, in the right workflows, at the right time.

    The enterprises that prove AI ROI measure both — but they lead with business outcomes and use technical metrics as diagnostic tools. When revenue impact declines, they look at technical metrics to diagnose why. When accuracy drops, they assess whether it affects a high-value workflow or a low-impact one. The hierarchy matters: business outcomes first, technical metrics in service of understanding those outcomes.

    The MEASURE Step: Building Your AI Scorecard

    The MEASURE step in the SEE, MEASURE, DECIDE, ACT playbook translates these principles into a practical framework. It starts with three requirements:

    Baselines before AI. Without a baseline, you’re reporting output, not impact. What was the metric before AI? If a customer support agent reduces average handle time, what was the average handle time before the agent was deployed? If an AI tool accelerates document review, how long did review take manually? Baselines establish the counterfactual — the “what would have happened without AI” that separates real impact from activity.

    Attribution models. AI rarely operates in isolation. When revenue increases after deploying a sales AI tool, how much of that increase is attributable to AI versus seasonal trends, marketing campaigns, or pricing changes? Attribution isn’t perfect, but it’s necessary. Even a directional attribution model (comparing teams with AI to teams without, or measuring pre/post performance in the same team) is better than claiming all improvement for AI.

    Time horizons that match the business cycle. A lead generation AI doesn’t show revenue impact in week one. It shows impact when those leads close — which in enterprise B2B might be 90 to 180 days later. A compliance AI doesn’t show risk reduction until the next audit cycle. Measuring AI ROI on a monthly sprint cadence misses outcomes that operate on quarterly or annual timelines. CFOs understand long payback periods. They don’t accept unmeasured ones.

    The result is a balanced AI scorecard: one to two business outcome metrics (the value metrics that appear in board presentations), one to two operational metrics (the efficiency indicators that show how AI is performing), and governance metrics (risk indicators that ensure AI operates within acceptable boundaries). This isn’t about tracking more metrics. It’s about tracking the right ones — and presenting them in the language your CFO speaks.

    Getting Started

    If you’re tracking AI adoption but not AI outcomes, start with three steps. First, identify the three to five business KPIs that your CFO or board reviews quarterly. Second, map each AI initiative to the KPI it should influence — if an AI initiative can’t be mapped to a business KPI, that’s a signal worth examining. Third, instrument measurement: establish baselines, deploy tracking, and commit to a review cadence that matches your business cycle.

    The 20% of enterprises that prove AI revenue impact aren’t using more sophisticated models. They’re using more sophisticated measurement. They defined what success looks like in financial terms before deploying AI, and they built the instrumentation to prove it. That discipline — not better technology — is what separates the organizations scaling AI from the organizations stuck explaining adoption dashboards to skeptical boards.

    Olakai’s custom KPI tracking lets you define the business metrics that matter and connect them to AI activity in real time. And Future of Agentic’s KPI library provides ready-made metric templates by use case, so you don’t have to start from scratch.

    Ready to move beyond adoption dashboards? Schedule a demo and we’ll show you how enterprises connect AI usage to the business metrics their CFOs actually want to see.

  • The Enterprise AI Revenue Gap: What 3,235 Leaders Reveal

    The Enterprise AI Revenue Gap: What 3,235 Leaders Reveal

    Deloitte just surveyed 3,235 business and IT leaders across 24 countries for its State of AI in the Enterprise 2026 report, and the headline finding lands like a punch: 74% of organizations say they want AI to grow revenue. Only 20% have actually seen it happen.

    That is not a rounding error. That is a 54-point gap between ambition and reality — and it explains why boardrooms across every industry are shifting from “how much are we investing in AI?” to “what exactly are we getting back?”

    The Revenue Gap Is Not a Technology Problem

    The instinct is to blame the technology. Models hallucinate, integrations break, data is messy. But Deloitte’s data tells a different story. The enterprises stuck in that 80% are not failing because the AI does not work. They are failing because they cannot prove that it does.

    Consider the numbers: 37% of organizations in the survey are using AI at a surface level with minimal process changes. They have deployed copilots and chatbots across teams, but nothing fundamental has shifted. The AI runs alongside existing workflows instead of transforming them — and without transformation, there is no measurable business outcome to point to. When the CFO asks what the AI program returned last quarter, the answer is a shrug wrapped in anecdotes.

    The organizations in the 20% who are seeing revenue growth did something different. They tied AI deployments to specific business KPIs from day one. They instrumented their programs to measure AI ROI continuously — not in a quarterly review, but in real time. And critically, they built the governance structures that allowed them to scale safely from pilot to production.

    Pilot Purgatory: The Graveyard of AI Ambition

    Deloitte found that only 25% of organizations have moved 40% or more of their AI pilots into production. Let that sink in. Three out of four enterprises have the majority of their AI initiatives still sitting in pilot mode — consuming budget, occupying engineering time, and delivering precisely nothing to the bottom line.

    This is the phenomenon we have written about as the journey from AI experimentation to measurable business impact. The pattern is consistent: a team builds a promising proof of concept, it performs well in controlled conditions, and then it stalls. The reasons vary — insufficient data pipelines, unclear ownership, missing security approvals — but they share a common root. Nobody established the measurement framework that would have justified the investment needed to cross the production threshold.

    Without hard numbers showing what a pilot delivered in its controlled environment, the business case for scaling it evaporates. And so the pilot sits. The team moves on to the next experiment. The cycle repeats. Deloitte’s survey confirms what many CIOs already feel: enterprise AI has become a graveyard of promising experiments that never grew up.

    Enterprise AI: Ambition vs Reality — four gaps from Deloitte State of AI 2026 survey showing revenue, pilot, governance, and access divides

    The Agentic AI Wave Is Coming — And Governance Is Not Ready

    If the current state of AI adoption is sobering, the next wave should genuinely concern enterprise leaders. Deloitte reports that agentic AI usage is expected to surge from 23% to 74% of enterprises within two years. Eighty-five percent of companies are already planning to customize and deploy autonomous agents.

    The problem? Only 21% have mature governance frameworks for agentic AI.

    Agentic AI is fundamentally different from the chatbots and copilots most enterprises have deployed so far. Agents do not wait for a human to type a prompt. They take autonomous actions — executing multi-step workflows, calling APIs, making decisions, and interacting with production systems. An ungoverned chatbot might give a bad answer. An ungoverned agent might execute a bad decision at scale, with real financial and operational consequences. For a structured approach to governing agents proportionally, see our AI risk heatmap framework.

    The governance gap for agentic AI is not abstract. It is the difference between an agent that autonomously processes customer refunds within policy and one that processes them without any guardrails at all. It is the difference between an agent whose cost-per-execution is tracked and one that silently racks up API bills nobody sees until the invoice arrives.

    What Separates the 20% From the 80%

    Across Deloitte’s data and our own experience working with enterprises deploying AI at scale, three patterns consistently separate organizations that achieve measurable returns from those that do not.

    They measure from day one, not day ninety. The enterprises delivering AI revenue growth did not bolt on measurement as an afterthought. They defined what success looks like before a single model was deployed — tying each initiative to a specific KPI, whether that is time saved per ticket, revenue influenced per campaign, or cost reduced per transaction. When Deloitte found that the 20% were disproportionately concentrated in organizations with mature AI programs, it was not because those programs had better technology. It was because they had better instrumentation.

    They govern proportionally, not reactively. The 21% with mature agent governance did not get there by locking everything down. They built tiered frameworks where low-risk AI applications move fast with light oversight, while high-risk autonomous agents face rigorous approval and monitoring. Our CISO governance checklist provides the template for building exactly this kind of tiered framework. This approach avoids the two failure modes that plague most enterprises: either everything is blocked by compliance reviews that take months, or everything is approved with a wave of the hand and nobody knows what is actually running.

    They have a unified view. Deloitte found that workforce access to sanctioned AI tools expanded 50% in a single year — from under 40% to roughly 60% of employees. That is a staggering increase in the surface area that needs visibility. The enterprises succeeding at AI are the ones who can answer, across their entire organization, which tools are being used, by whom, for what purpose, and with what result. The enterprises stuck in the 80% are managing each AI tool in its own silo, each with its own vendor dashboard, none of them talking to each other.

    The Clock Is Ticking

    Deloitte’s report arrives at a moment when patience for AI investment without returns is running out. This is no longer a technology-forward bet that boards are willing to make on faith. The $700 billion that the four major hyperscalers plan to spend on AI infrastructure in 2026 has already triggered an investor reckoning — Microsoft lost $360 billion in market cap in a single day when its AI spending outpaced its Azure revenue growth. If Wall Street is demanding AI ROI from the world’s most sophisticated technology companies, your board is not far behind.

    The enterprises that will thrive through this reckoning are not the ones spending the most on AI. They are the ones who can prove what their AI spending returns. That starts with measurement — real, continuous, outcome-tied measurement — and it scales with governance that grows alongside the program.

    When your CFO asks what the AI program delivered this quarter, what will your answer be?

    Schedule a demo to see how Olakai helps enterprises measure AI ROI, govern risk, and close the gap between AI investment and business impact.

  • The AI Visibility Audit: What You Can’t See Is Costing You

    The AI Visibility Audit: What You Can’t See Is Costing You

    The CIO of a mid-market financial services firm thought she had a handle on AI adoption. Her team had sanctioned three tools, trained 200 employees, and built a governance policy around them. Then she ran an AI visibility audit. The audit found 23 AI tools running across the organization — seven times what she expected. Customer service had adopted a chatbot through a free trial. Marketing was using three different content generators. Two engineering teams were running code assistants that had never been security-reviewed. And an entire business unit had been piping client data through an AI summarization tool that stored data on external servers.

    She’s not unusual. According to the Torii 2026 Benchmark Report, 84% of organizations consistently discover more AI tools than expected during audits. And 31% find new unsanctioned tools every single month.

    This is the SEE problem — the first and most foundational step in the SEE, MEASURE, DECIDE, ACT framework for proving AI ROI. (This is the first of four companion deep-dives — see also MEASURE, DECIDE, and ACT.). You cannot measure what you cannot see. And in most enterprises today, the AI landscape is far larger, more fragmented, and more exposed than anyone in the C-suite realizes.

    The Visibility Crisis by the Numbers

    The scale of unsanctioned AI usage has grown faster than most security and IT teams anticipated. A 2025 UpGuard study found that more than 80% of workers — including nearly 90% of security professionals — use unapproved AI tools on the job. That last part bears repeating: the people responsible for protecting the organization are themselves using tools that haven’t been vetted.

    Deloitte’s 2026 State of AI survey tells the supply side of this story. Workforce access to AI tools expanded by 50% in a single year, from fewer than 40% of employees to roughly 60%. But that figure only counts sanctioned tools. The actual adoption rate — including shadow AI — is far higher. Research from Portal26 found that 73.8% of ChatGPT accounts used in the workplace are non-corporate accounts that lack enterprise security and privacy controls. For Gemini, that figure is 94.4%.

    The result is an AI ecosystem that leadership cannot see, security cannot govern, and finance cannot account for. Only 38% of organizations report knowing which AI applications their employees actually use.

    What Invisibility Actually Costs

    The cost of this visibility gap isn’t hypothetical. IBM’s 2025 Cost of a Data Breach report found that breaches involving shadow AI add $670,000 to the average breach cost compared to organizations with low or no shadow AI exposure. The average organization now experiences 223 AI-related data security incidents per month — incidents that range from sensitive data shared with external AI services to policy violations that create compliance exposure.

    But security costs are only one dimension. Hitachi Vantara research estimates that data infrastructure issues — many driven by ungoverned AI tooling — contribute to $108 billion in wasted annual AI spend across enterprises. When teams adopt AI tools independently, they duplicate capabilities, fragment data flows, and create redundant infrastructure costs that nobody tracks because nobody can see the full picture.

    Then there’s the opportunity cost. If you don’t know what AI your organization is running, you cannot measure whether it’s working. You cannot identify which tools deliver value and which ones burn budget. You cannot rationalize spending, consolidate licenses, or negotiate enterprise agreements. And you cannot answer the one question the board increasingly cares about — what’s the return on our AI investment — because you don’t even know what the investment includes.

    Why Traditional Discovery Fails

    Most IT organizations approach AI discovery the same way they approach software asset management: check the procurement records, run a network scan, send out a survey. None of these methods work for AI.

    Procurement records miss AI tools that employees adopt through free tiers, browser extensions, or personal accounts. Network scans miss browser-based AI tools that look like regular web traffic. Surveys depend on employees self-reporting usage they may not think of as “AI” — or usage they know isn’t sanctioned and don’t want to disclose.

    The deeper problem is velocity. Employees adopt new AI tools faster than security teams can evaluate them. Eighty-three percent of organizations report that employees install AI tools faster than security can track, according to industry surveys. A quarterly discovery audit is fundamentally mismatched against a weekly adoption cycle.

    And the challenge is getting more complex, not simpler. Embedded AI features — AI capabilities built into tools employees already use, like email clients, CRM platforms, and productivity suites — fly under the radar entirely. An employee isn’t “adopting a new AI tool” when their email client adds AI-powered reply suggestions. But the data exposure risk is real, and the cost shows up in per-seat licensing increases that finance sees but can’t attribute.

    What a Real AI Visibility Audit Looks Like

    A proper AI visibility audit goes beyond inventory. It answers four questions that are prerequisites to everything else in the AI ROI playbook:

    What AI is running? A complete catalog of AI tools, models, and capabilities across the organization — including assistive AI (copilots, chatbots, content generators), agentic AI (autonomous agents executing workflows), and embedded AI (features within existing software). This isn’t a one-time list. It’s a continuously updated inventory that captures new tools as they appear.

    Who is using it? Usage patterns by team, department, role, and individual. Not to police employees, but to understand where AI adoption is concentrated, where training gaps exist, and where usage patterns suggest risk or opportunity. If 60% of your customer success team uses an AI tool daily but 5% of your sales team does, that’s a signal worth understanding.

    What data is it touching? The critical question from both a security and compliance perspective. Which AI tools have access to customer data, financial records, intellectual property, or regulated information? Are employees sharing sensitive data with external AI services? The shadow AI risk isn’t just that unauthorized tools exist — it’s that unauthorized tools often handle the most sensitive data, because employees turn to AI precisely when they’re working with complex, high-value information.

    What is it costing? The total cost of AI across the organization, including sanctioned licenses, API consumption, infrastructure, and the hidden costs of shadow AI — duplicate tools, wasted capacity, and the remediation costs when things go wrong. Until you can see the full cost picture, you cannot calculate ROI.

    From Visibility to Value

    The SEE step isn’t an end in itself. It’s the foundation that makes everything else possible. Once you have visibility into your AI ecosystem, you can move to MEASURE — connecting AI activity to business outcomes. You can identify which tools are delivering value and which are creating risk. You can rationalize spending, consolidate tooling, and negotiate from a position of knowledge rather than ignorance.

    The enterprises that close the AI revenue gap — the 20% who prove AI drives results, according to Deloitte’s 2026 survey — start here. Not with measurement. Not with governance. With visibility. Because every dollar of AI ROI you can prove is built on a foundation of knowing what AI you have, who’s using it, what data it touches, and what it costs.

    The visibility audit typically reveals three immediate value opportunities: tool consolidation (reducing redundant AI spending by 20-30%), risk reduction (identifying unvetted tools handling sensitive data), and measurement readiness (instrumenting high-value AI workflows for ROI tracking). Most enterprises find that the audit pays for itself through spend rationalization alone.

    Ready to see what AI is actually running across your organization? Schedule a demo and we’ll show you how Olakai provides unified visibility across your entire AI ecosystem — sanctioned and shadow, assistive and agentic.

  • The Enterprise AI ROI Playbook: See, Measure, Decide, Act

    The Enterprise AI ROI Playbook: See, Measure, Decide, Act

    Half of CEOs believe their jobs are on the line if AI doesn’t pay off. Yet according to BCG’s AI Radar 2026 survey, 90% of chief executives believe agentic AI will deliver measurable ROI this year. That’s a remarkable level of conviction given what the data actually shows: IBM found that only 29% of executives can confidently measure their AI returns, and just 16% have scaled AI initiatives enterprise-wide.

    The confidence is there. The measurement capability is not. And that gap — between what leaders believe AI can do and what they can prove it has done — is where budgets get cut, pilots stall, and competitors pull ahead.

    This is why we built the SEE, MEASURE, DECIDE, ACT playbook — a four-step framework that takes enterprises from “we think AI is working” to “here’s exactly what it’s worth.” It’s the same methodology we use with every enterprise we work with, and the same framework that separates the 20% of organizations seeing real revenue impact from AI from the 74% who want it but can’t prove it.

    The Playbook Gap

    Deloitte’s 2026 State of AI survey captured the problem in a single data point: 74% of enterprises say they want AI to drive revenue growth. Only 20% have achieved it. That’s 3,235 business leaders across 24 countries essentially saying the same thing — we’re investing heavily, but we can’t connect the investment to results.

    The issue isn’t the technology. AI models are more capable than ever. The issue is that most enterprises lack a systematic approach to proving value. They launch pilots without defining what success looks like. They measure activity (tokens processed, queries handled) instead of outcomes (revenue influenced, costs avoided). And when the CFO asks “what’s our return?”, the answer is a shrug wrapped in a slide deck full of usage charts.

    BCG found that companies plan to double their AI spending in 2026, pushing AI investment to roughly 1.7% of total revenues. CEOs are committing more than 30% of their AI budgets specifically to agentic AI. The money is flowing. But without a measurement playbook, most of it flows into a black box.

    Step 1: SEE — Map Your AI Ecosystem

    You can’t measure what you can’t see. And in most enterprises, the AI landscape is far more sprawling than leadership realizes.

    Workforce access to AI tools expanded by 50% in just one year, according to Deloitte — from fewer than 40% of workers to roughly 60% now equipped with sanctioned AI tools. That’s just the sanctioned ones. Factor in the tools employees adopt on their own — the shadow AI that bypasses procurement and IT review — and the real number is significantly higher.

    The SEE step is an AI visibility audit. It answers three questions: What AI tools and models are running across the organization? Who is using them? And what data are they touching? This isn’t a one-time inventory. It’s an ongoing discovery process, because AI adoption in enterprises is a moving target — new tools appear weekly, usage patterns shift monthly, and the risk surface evolves with every new integration.

    Most enterprises discover during this step that they have three to five times more AI touchpoints than they thought. Customer service teams running chatbots that marketing doesn’t know about. Engineering teams experimenting with code assistants that security hasn’t reviewed. Sales teams piping prospect data through AI tools that legal hasn’t vetted. Until you see the full picture, every other step in this playbook is built on incomplete information.

    Step 2: MEASURE — Connect Activity to Business Outcomes

    Once you can see what’s running, the next step is measuring what matters. And “what matters” is almost never what teams measure first.

    The natural instinct is to track operational metrics: response time, tokens consumed, uptime, error rates. These are useful for engineering but meaningless to the CFO. The measurement step connects AI activity to the business KPIs that drive budget decisions — revenue influenced, costs reduced, risk mitigated, time recovered.

    This is where most enterprises stall. IBM’s research found that while 79% of organizations see productivity gains from AI, only 29% can measure ROI confidently. The productivity is real but unquantified. A customer success agent saves each rep 45 minutes per day — but nobody has connected that time savings to the additional accounts each rep can now manage, or the churn reduction that comes from faster response times.

    Effective AI measurement requires three elements. First, a baseline: what was the metric before AI? Without a counterfactual, you’re reporting output, not impact. Second, attribution: which portion of the improvement is actually due to AI versus other factors? Third, a time horizon that matches the business cycle. An AI agent that qualifies leads doesn’t show revenue impact in week one. It shows impact when those leads close, which in enterprise B2B might be 90 days later.

    The 20% of enterprises that prove AI revenue impact aren’t using more sophisticated models. They’re using more sophisticated measurement. They define the success KPI before deployment, not after. They instrument their AI systems to capture business outcomes, not just technical telemetry. And they present results in the language the CFO speaks — dollars, not tokens.

    Step 3: DECIDE — Turn Data Into Scaling Decisions

    Measurement without decision-making is just reporting. The DECIDE step uses the data from MEASURE to answer the questions that actually move AI forward in an organization: Which pilots get promoted to production? Which get sunset? Where should the next investment go?

    This is where the 30-to-45-day structured pilot becomes critical. Rather than running open-ended experiments that drift for months, a time-boxed pilot with predefined KPIs produces a clear decision point. At the end of 30 days, you have data. Not opinions, not anecdotes — data that shows whether the AI investment is generating the business outcome you defined in the MEASURE step.

    The enterprises stuck in pilot purgatory almost always lack this decision framework. They have pilots running for six, nine, twelve months with no clear criteria for what constitutes success or failure. The result is the worst possible outcome: continued investment without conviction, where the AI initiative is too expensive to ignore and too poorly measured to champion.

    A proper DECIDE framework answers four questions with data: Is the AI system delivering the outcome KPI we defined? Is the cost-to-value ratio favorable? Can the governance and risk profile support scaling? And does the organization have the operational readiness to absorb the change?

    Google Cloud’s research found that top-performing enterprises generate $10.30 in value for every dollar invested in AI, while the average is $3.70. The difference isn’t luck. It’s disciplined decision-making about which investments to scale and which to cut — and that discipline is only possible with measurement data.

    Step 4: ACT — Scale With Confidence

    The final step is where measurement pays off: scaling the AI investments that prove their value while governing the entire portfolio continuously.

    Deloitte found that 25% of organizations now report AI having a “transformative” effect — up from just 12% a year ago. These are the enterprises that have moved through SEE, MEASURE, and DECIDE, and are now deploying AI at scale with the data to back every decision. They’re not guessing which use cases deserve investment. They know, because they measured.

    But scaling introduces new challenges that require continuous measurement. An AI agent that performs well with 100 users may behave differently with 10,000. Cost structures change at scale. Risk profiles shift as AI touches more sensitive data and higher-stakes decisions. The ACT step isn’t a one-time event — it’s an ongoing cycle of deploying, measuring, governing, and optimizing.

    This is where governance and measurement converge. The enterprises with the strongest ROI data are also the ones with the most rigorous governance frameworks. Not because governance is a checkbox exercise, but because governance forces the discipline that measurement requires: defining what AI is allowed to do, instrumenting how it performs, and maintaining the accountability structures that ensure continuous improvement.

    BCG reports that 72% of CEOs are now the primary decision-makers on AI, double the share from a year ago. These executives don’t want dashboards full of technical metrics. They want a portfolio view: which AI investments are generating returns, which ones need intervention, and where the next opportunity lies. The SEE, MEASURE, DECIDE, ACT framework gives them exactly that.

    Building Your Playbook

    The 74-to-20 gap Deloitte identified isn’t permanent. But it won’t close on its own. It closes when enterprises stop treating AI measurement as an afterthought and start treating it as the foundation of every AI initiative.

    Start with SEE: audit your AI ecosystem. You’ll likely find more than you expected. Move to MEASURE: define the business outcomes that matter and instrument your AI systems to capture them. Progress to DECIDE: use 30-day structured pilots to generate decision-quality data. And then ACT: scale what works, govern what runs, and keep measuring.

    The enterprises in the 20% didn’t get there with better AI. They got there with better measurement. The playbook isn’t complicated. The hard part is committing to it before the CFO asks the question you can’t answer. Our AI ROI measurement framework breaks down the methodology step by step, and Future of Agentic’s KPI library offers specific metrics by use case to get you started.

    Ready to build your AI ROI playbook? Schedule a demo and we’ll show you how enterprises are turning AI activity into measurable business outcomes.

  • AI Pilot to Production: Why Measurement Is the Decisive Factor

    AI Pilot to Production: Why Measurement Is the Decisive Factor

    When JPMorgan Chase launched its LLM Suite platform in summer 2024, something unusual happened: within eight months, 200,000 employees were using it daily. No mandate. No compliance requirement. Just organic adoption at a scale that most enterprises can only dream about.

    Meanwhile, at most other organizations, a very different story was playing out. MIT’s 2025 “GenAI Divide” report, based on 150 executive interviews and 300 public AI deployments, found that 95% of generative AI pilots fail to deliver rapid revenue acceleration. Not 50%. Not even 80%. Ninety-five percent.

    The gap between JPMorgan and everyone else isn’t about technology, talent, or even budget. It’s about something far more fundamental: whether you can prove your AI is working.

    The Measurement Gap Is the Real Pilot Killer

    Enterprise AI has an accountability problem. Organizations are spending aggressively — global generative AI investment tripled to roughly $37 billion in 2025 — but most cannot answer a simple question: What’s the ROI on our AI?

    The numbers tell a stark story. McKinsey’s State of AI 2025 report found that 88% of organizations now use AI regularly in at least one business function. Yet only 6% qualify as “AI high performers” who can attribute more than 5% of total EBIT to AI. The other 82% are running AI, but they cannot connect it to business results.

    Deloitte’s State of AI in the Enterprise 2026 survey — covering 3,000 director-to-C-suite leaders across 24 countries — revealed what might be the most telling statistic of all: 74% of organizations want AI to grow revenue, but only 20% have actually seen it happen. That’s not a technology gap. That’s a measurement gap.

    Why “Pilot Purgatory” Is Getting Worse, Not Better

    You might expect the pilot-to-production problem to improve as AI matures. It’s not. S&P Global data shows that 42% of companies abandoned most of their AI initiatives in 2025, more than double the 17% abandonment rate just one year earlier. The average enterprise scrapped 46% of AI pilots before they ever reached production — a pattern we first explored in From AI Experimentation to Business Impact. For every 33 prototypes built, only 4 made it into production — an 88% failure rate at the scaling stage.

    The pattern is consistent: organizations launch pilots with enthusiasm, run them for three to six months, then struggle to justify continued investment. Without baseline metrics established before deployment, there’s no way to quantify what AI actually changed. Our AI ROI measurement framework provides the methodology for establishing those baselines and tracking outcomes. Without ongoing measurement, there’s no way to distinguish a successful pilot from an expensive experiment. And without clear ROI data, there’s no executive willing to sign off on scaling.

    Gartner reinforced this trajectory in June 2025, predicting that over 40% of agentic AI projects will be canceled by the end of 2027, citing three drivers: escalating costs, unclear business value, and inadequate risk controls. The emphasis on “unclear business value” is telling — it’s not that the AI doesn’t work, it’s that nobody built the infrastructure to prove that it does.

    AI Pilot Purgatory — 42% of companies abandoned AI in 2025 vs. 17% in 2024, with findings from MIT, S&P Global, and McKinsey

    What the 5% Do Differently

    The companies that successfully move AI from pilot to production share a pattern that has nothing to do with having better models or bigger datasets. They build measurement into the process from day one.

    JPMorgan didn’t just deploy AI — they tracked adoption rates, time savings, and productivity gains from the first week. Their AI benefits are growing 30-40% annually, and they know this because they measure it. Walmart didn’t just experiment with AI in their supply chain — they documented that route optimization eliminated 30 million unnecessary delivery miles and avoided 94 million pounds of CO2 emissions. Their customer service AI cut problem resolution times by 40%, a number they can report because they established baselines before deployment.

    This is the pattern MIT’s research confirmed across hundreds of deployments: the companies that scale AI successfully are the ones that treat measurement as infrastructure, not an afterthought. They know which processes AI is accelerating, by how much, and at what cost. They can calculate the total cost of ownership — including the API costs, engineering time, and maintenance burden that most organizations bury in IT budgets. And they can present executives with a clear picture: here’s what AI costs, here’s what it delivers, and here’s why scaling it makes financial sense.

    The Four Phases of Scaling (and Where Most Organizations Get Stuck)

    Successfully moving AI from pilot to production typically follows four phases, each gated by measurement milestones rather than arbitrary timelines.

    Phase 1: Validate value (weeks 1-4). Deploy the AI solution with a small group and establish clear baselines. What does the process look like without AI? How long does it take? What does it cost? What’s the error rate? Without these pre-AI measurements, you’ll never be able to quantify impact. Most organizations skip this step entirely and then wonder why they can’t prove ROI six months later.

    Phase 2: Harden for production (weeks 5-10). Once you have evidence that the AI delivers measurable value, build the governance and monitoring infrastructure needed for scale. This means policy enforcement, access controls, audit trails, and cost tracking. It also means ensuring someone owns ongoing operations — not as a side project, but as a defined responsibility.

    Phase 3: Controlled expansion (weeks 11-16). Roll out to a broader group while continuing to measure. Are the gains from Phase 1 holding at scale? Are costs scaling linearly or exponentially? Are new user segments finding different use cases? This phase is where many organizations discover that their pilot’s curated dataset doesn’t translate to messy real-world data — Gartner found that data quality issues derail 85% of AI projects at this stage.

    Phase 4: Full deployment and continuous optimization. With validated ROI data from the first three phases, you have the evidence to justify enterprise-wide investment. But the measurement doesn’t stop — it shifts from proving value to optimizing it. Which teams are getting the most benefit? Where are costs disproportionate to returns? What new use cases are emerging?

    The organizations that stall are almost always stuck between Phase 1 and Phase 2. They ran a pilot, it “seemed to work,” but they never established the baselines or tracking needed to prove it. So the pilot sits in limbo — too promising to kill, too unproven to scale.

    Buy vs. Build: A Measurement Shortcut

    MIT’s research uncovered a surprising finding about the build-versus-buy decision. Purchasing AI tools from specialized vendors and building partnerships succeeds roughly 67% of the time, while internal builds succeed only about 22% of the time. Our analysis of 100+ AI agent deployments confirms this pattern. The gap is striking, and measurement is a significant part of the explanation.

    Specialized vendors have already solved the measurement problem for their specific domain. They’ve established the benchmarks, built the tracking, and validated the ROI across hundreds of customers. When an enterprise buys rather than builds, they’re importing not just the technology but the measurement framework that proves it works.

    Internal builds, by contrast, require organizations to solve two problems simultaneously: making the AI work and building the infrastructure to prove it works. Most teams focus entirely on the first problem and neglect the second.

    From Science Experiment to Business Case

    Harvard Business Review captured the core challenge in November 2025: “Most AI initiatives fail not because the models are weak, but because organizations aren’t built to sustain them.” Their five-part framework for scaling AI emphasizes that the bottleneck is organizational, not technical — and at the center of every organizational bottleneck is the inability to prove value.

    The path from pilot to production isn’t about better technology. It’s about building the measurement infrastructure that turns an AI experiment into a business case. That means establishing baselines before deployment, tracking outcomes continuously, calculating total cost of ownership honestly, and presenting results in terms executives care about: revenue impact, cost reduction, risk mitigation, and time to value.

    Without that measurement layer, every AI pilot is a science experiment. And enterprises don’t scale science experiments — they scale proven investments.

    Ready to move your AI from pilot to production? Schedule a demo to see how Olakai helps enterprises measure AI ROI, govern risk, and scale what works across every AI tool and team.